
Figures & data
Figure 1. Monthly total rainfall (mm), relative humidity (%), mean minimum and maximum temperature (°C) of Bako research station during 2020.
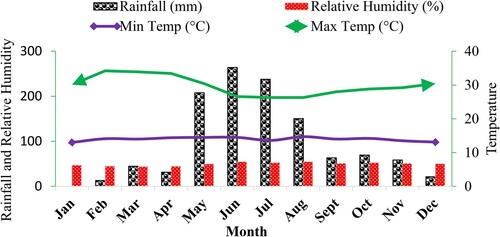
Table 1. Soil properties of the experimental site before sowing.
Table 2. Mean square of variance for different nodulation and yield associated traits as influenced by the main and interaction effects of inoculated common bean variety and NSPB fertilizer rate at Bako area. 2019.
Figure 2. The effect of NPSB blended fertilizer on total number of nodules/plant (left) and effective number of nodules/plant (right) of inoculated common bean varieties at Bako, western Ethiopia.
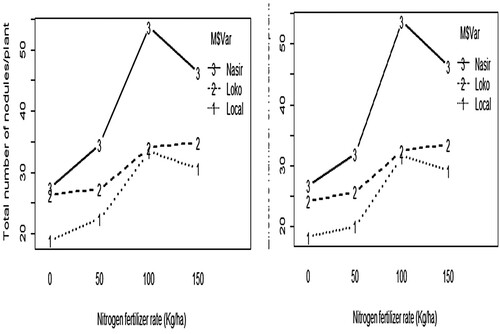
Figure 3. The effect of NPSB blended fertilizer on nodules fresh weight/plant (left) and nodules dry weight/plant (g) (right) of inoculated common bean varieties.
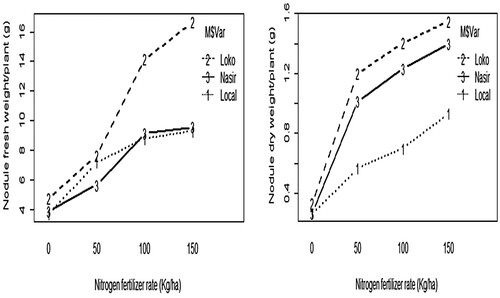
Table 3. Mean square of ANOVA for yield and yield component parameters as influenced by rhizobium inoculated common bean variety and NPSB blended fertilizer rate at Bako, 2020.
Figure 4. The effect of NPSB blended fertilizer on the number of pods per plant of inoculated common bean varieties.
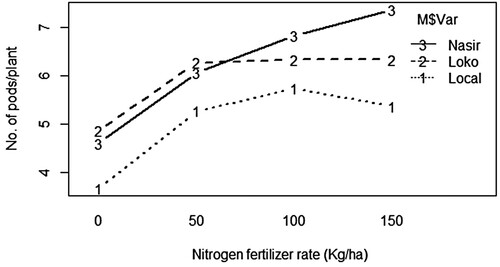
Figure 5. The interaction plot of inoculated common bean varieties and NPSB blended fertilizer levels on pod length (cm) of common bean.
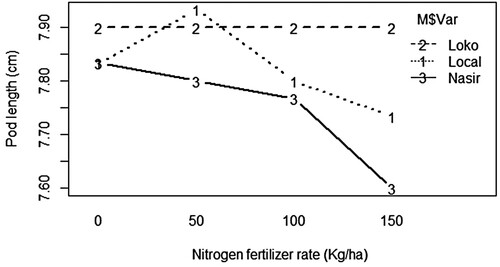
Figure 6. The effect of NPSB blended fertilizer on number of seeds/pod of inoculated common bean varieties.
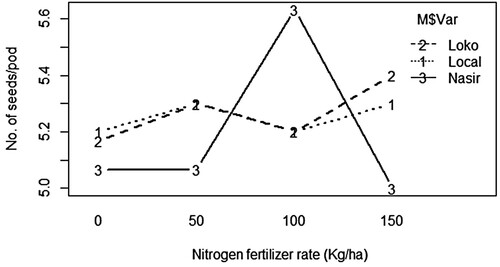
Figure 7. The effect of NPSB blended fertilizer on hundred seeds/weight (g) of inoculated common bean varieties.
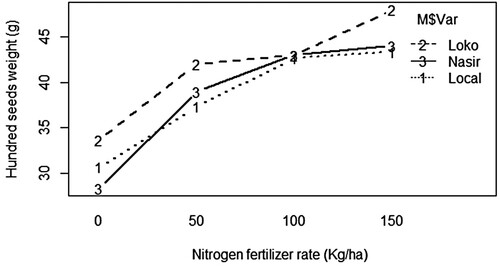
Figure 8. The effect of NPSB blended fertilizer on crop stand count of inoculated common bean varieties.
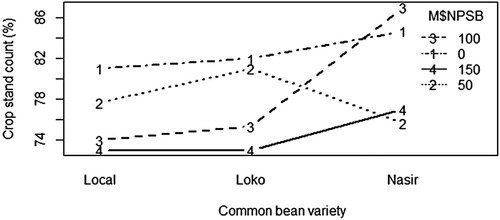
Figure 9. The interaction plot of inoculated common bean varieties and NPSB blended fertilizer on biomass yield (t/ha).
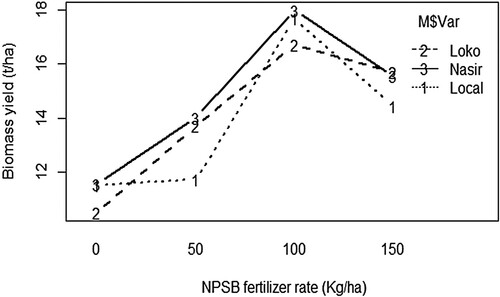
Figure 10. The effect of NPSB blended fertilizer on seed yield (kg/ha) of inoculated common bean varieties.
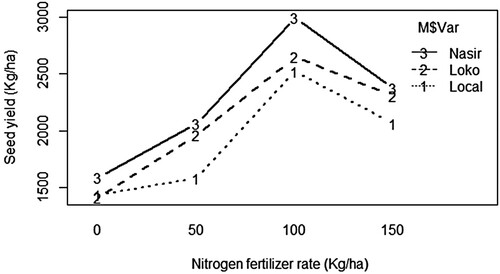
Figure 11. The effect of NPSB blended fertilizer on harvest index (%) of inoculated common bean varieties.
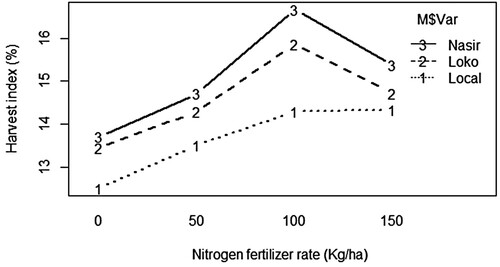
Table 4. Partial budget analysis of the effects NPSB rates on common bean varieties at Bako.
Data availability statement
All the data used in preparing this research paper is freely available and accessible as part of the article in a data repository known as FAIRsharing.org in https://figshare.com/ data repository with DOI:10.6084/m9.figshare.17033258.