
Figures & data
Table 1. Sequences of primers used quantitative real-time PCR.
Figure 1. The potential target genes of Pru and colitis were screened. (A) The gene volcano diagram shows the gene distribution in the microarray profile GSE54005. Downregulated genes were marked in green and upregulated genes were marked in red. (B) Chemical structure of Pru. (C) Venn diagram showing the collective targets between Pru and DEGs.
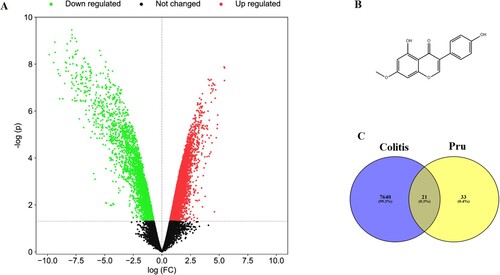
Figure 2. Clustered heat diagram of 21 collective genes.
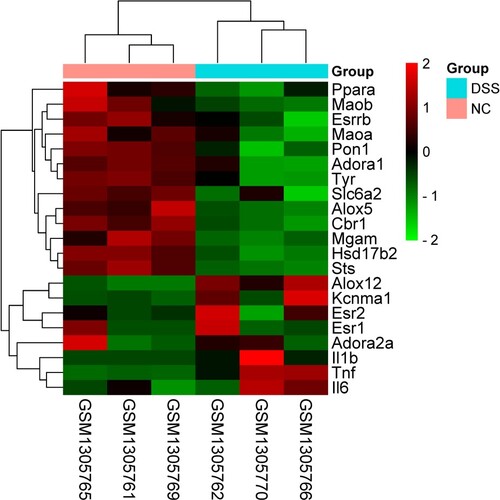
Figure 3. The PPI network of 21 collective genes. The darker the node color means the more important in this PPI network.
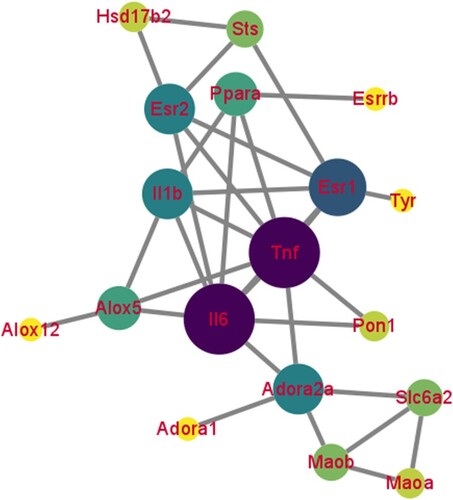
Figure 4. The enrichment analysis of 21 collective genes. (A) The KEGG enrichment analysis of the top 16 signaling pathways. (B) The GO enrichment analysis of the top 16 biological processes.
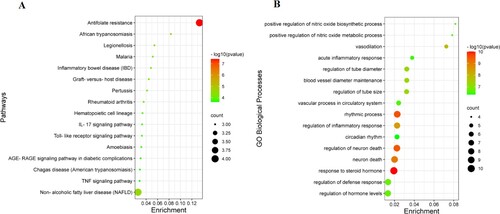
Figure 5. Effect of Pru on the rat model of colitis. (A) Bodyweight in different groups was measured at the end of the experiment. (B) Colon length in different groups was recorded. (C) Disease activity index scores. Experimental data were presented as mean ± SD. Significance: ###P < 0.001 in comparison with the control group; ***P < 0.001, **P < 0.01 in comparison with the DSS group.
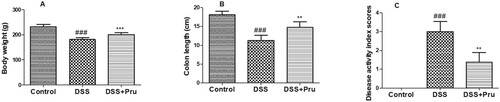
Figure 6. Pru ameliorated DSS-induced colon injury in rats. (A) Representative H&E-stained images in different groups (original magnification × 200). (B) Histological scores in different groups. Experimental data were presented as mean ± SD. Significance: ###P < 0.001 in comparison with the control group; ***P < 0.001 in comparison with the DSS group.
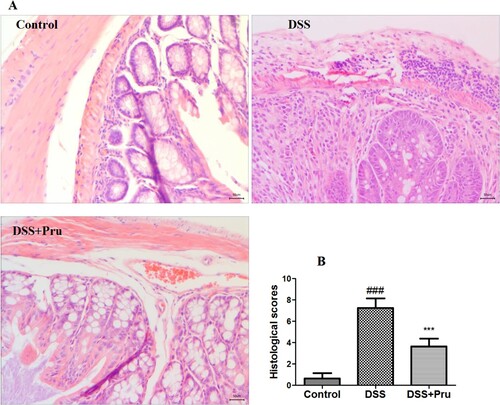
Figure 7. Pru inhibited the generation of inflammatory cytokines in a rat model of colitis. The levels of TNF-α (A), IL-6 (B), IL-1β (C), and IL-10 (D) were measured by ELISA kits in colon tissues. Experimental data were presented as mean ± SD. Significance: ###P < 0.001 in comparison with the control group; ***P < 0.001, **P < 0.01 in comparison with the DSS group.
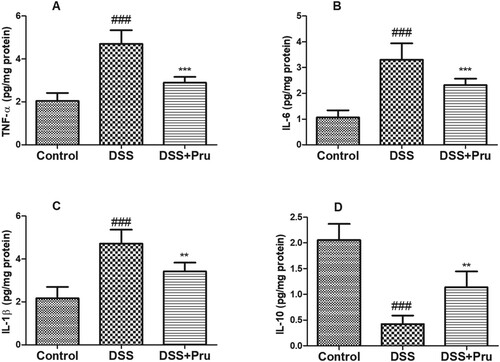
Figure 8. Pru down-regulated the inflammation-related gene expressions in a rat model of colitis. Gene expression levels of Tnf (A), Il6 (B), and Il1b (C) were measured by qRT-PCR in colon tissues. Experimental data were presented as mean ± SD. Significance: ###P < 0.001 in comparison with the control group; **P < 0.01 in comparison with the DSS group.
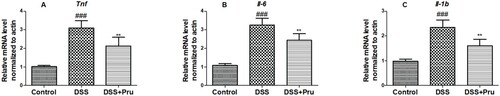
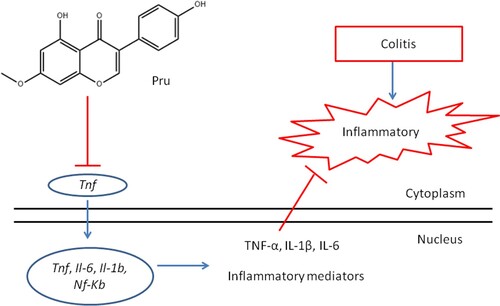
Figure 9. The possible mechanism of Pru in the treatment of colitis.
Data availability
The data for network pharmacology is available publicly from the GSE54005 dataset at https://www.ncbi.nlm.nih.gov/geo/query/acc.cgi?acc=GSE54005. Raw data for the animal experiment are available at http://doi.org/10.57760/sciencedb.01824.