
Figures & data
Figure 1. The top 20 differently expressed miRNAs in each two group.
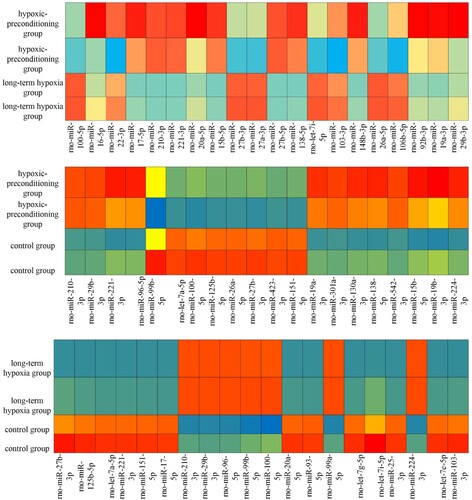
Table 1. The target genes of the hypoxia preconditioning group compared with the long-time hypoxia group.
Table 2. The target genes of the hypoxia preconditioning group compared with the control group.
Table 3. The target genes of long-time hypoxia group compared with control group.
Figure 2. The top 10 BP, CC and MF of GO terms in the hypoxia preconditioning group compared with the long-time hypoxia group.
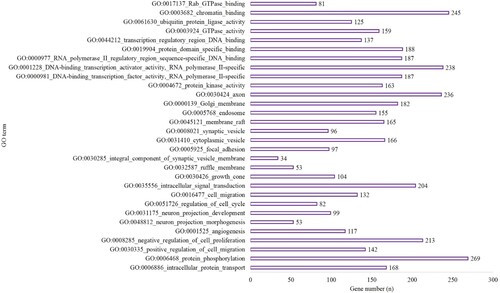
Figure 3. The top 10 terms of KEGG enrichment in the hypoxia preconditioning group compared with the long-time hypoxia group.
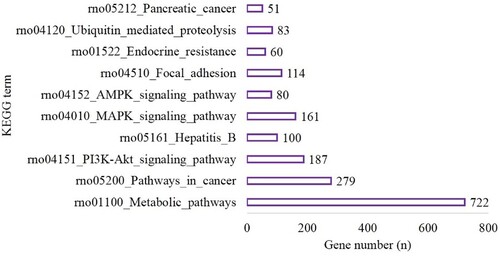
Figure 4. The top 10 BP, CC and MF of GO terms in the hypoxia preconditioning group compared with the control group.
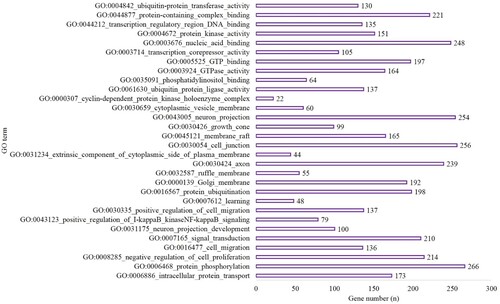
Figure 5. The top 10 terms of KEGG enrichment in the hypoxia preconditioning group compared with the control group.
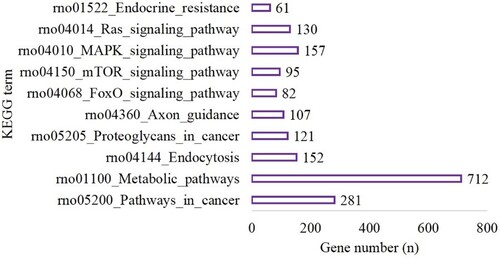
Figure 6. The top 10 BP, CC and MF of GO terms in the long-time hypoxia group compared with the control group.
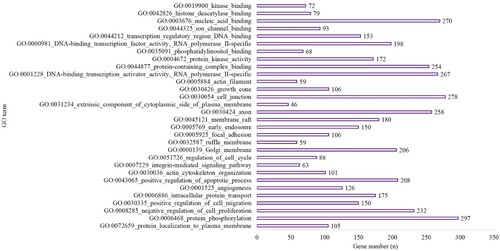
Figure 7. The top 10 terms of KEGG enrichment in the long-time hypoxia group compared with the control group.
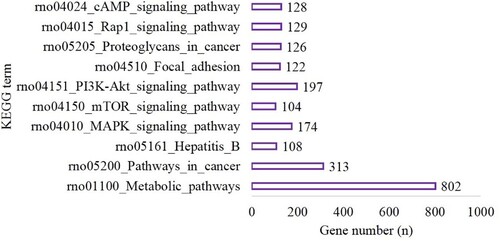
Figure 8. PPI networks. The color of genes gradually changed from purple to yellow as high scores to low scores based on the degree algorithm. (a) hypoxia preconditioning group compared with the long-time hypoxia group; (b): the hypoxia preconditioning group compared with the control group and (c): the long-time hypoxia group compared with the control group.
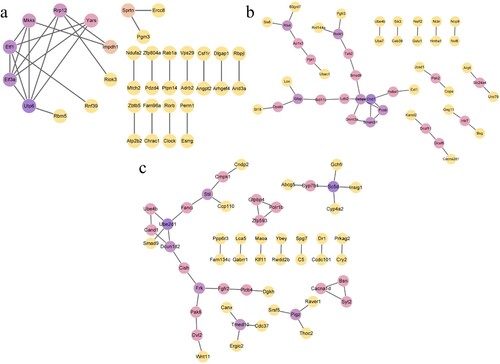
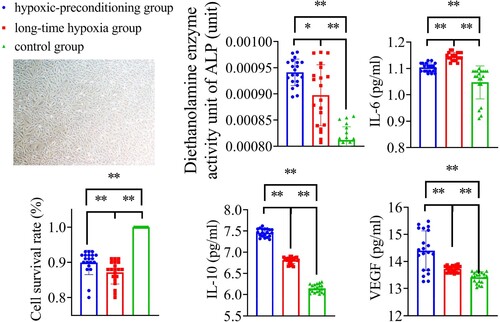
Figure 9. CCK-8 and cytokines detection results. Hypoxia preconditioning improved cell viability by CCK-8 assay (p < 0.01), enhanced ALP, IL10, and VEGF expression, and inhibited IL6 expression (p < 0.05), *p < 0.05, **p < 0.01. n = 20.
Data availability statement
The supplemental data used to support the findings of this study have been stored in Mendeley data repository (https://data.mendeley.com/datasets/6bx2p5zz84/1).