
Figures & data
Figure 1. Morphological observation of hair follicles across three developmental stages in cashmere goat. (A–C) Skin at embryonic day 45 (E45), 55 (E55), 65 (E65), respectively. (A) Forty-five days of embryonic period: dermal signal initiation; The induction of hair follicles is initiated around E45 and characterized by crowded epidermal keratinocytes, hair placode, and dermal condensate. (B) Fifty-five days of embryonic period: primary hair follicle genesis; the number of primary follicles increases significantly. (C) Sixty-five days of embryonic period: secondary hair follicle genesis, secondary follicles (SFs) start to form.
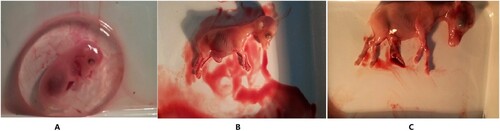
Figure 2. (A) Distribution of proteins containing different numbers of identified peptides, (B) distribution of the identified proteins among the different molecular weight classes, (C) coverage of proteins by the identified peptides, (D) distribution of protein abundance ratio.
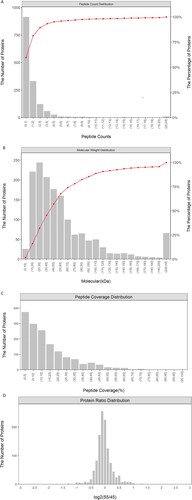
Figure 3. Hierarchical cluster analysis of protein expression profiles from nine skin samples with 159 proteins.
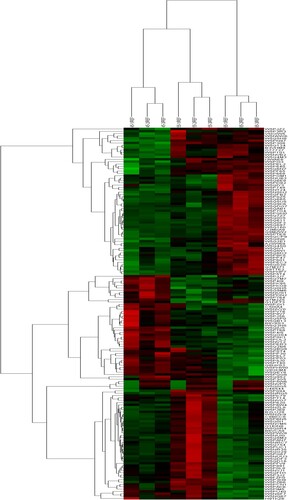
Table 1. Selected proteins constantly increased through the whole embryonic developmental stages of placode formation in cashmere goat skin.
Table 2. Specific information of these eight proteins in the form of tables.
Figure 4. Venn diagram depicting the overlap between proteins differentially expressed between E55 vs. E45, E65 vs. E55, and E65 vs. E45.
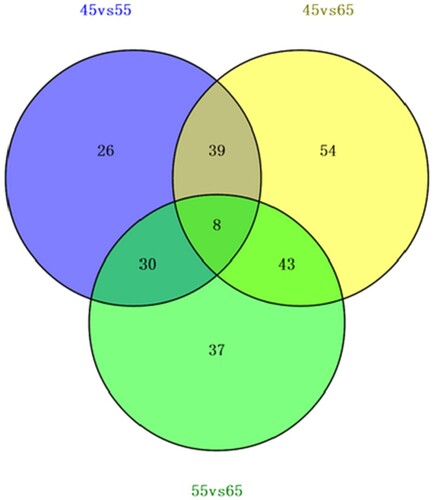
Figure 5. GO Analysis of differentially expressed Proteins in three developmental stages of hair follicles (P < .05).
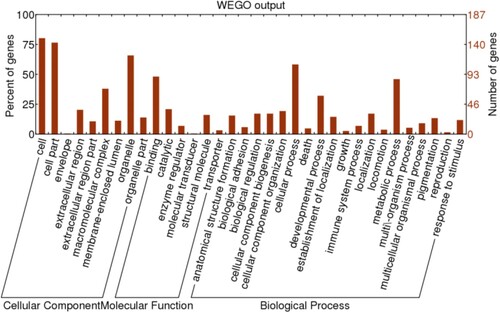
Table 3. KEGG pathway analysis.
Figure 6. (A) The protein–protein interaction network for the differentially expressed proteins. (B) The differentially expressed proteins are highlighted in yellow.
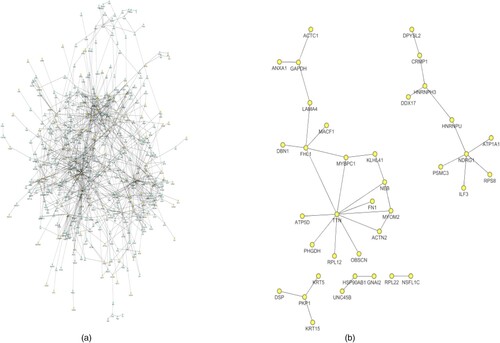
Table 4. KEGG pathway analysis.
Supplemental Material
Download Zip (571.2 KB)Data availability statement
The mass spectrometry proteomics data have been deposited to the ProteomeXchange Consortium (http://proteomecentral.proteomexchange.org) via the iProX partner repository (Ma et al. Citation2019) with the dataset identifier PXD035366.