
Figures & data
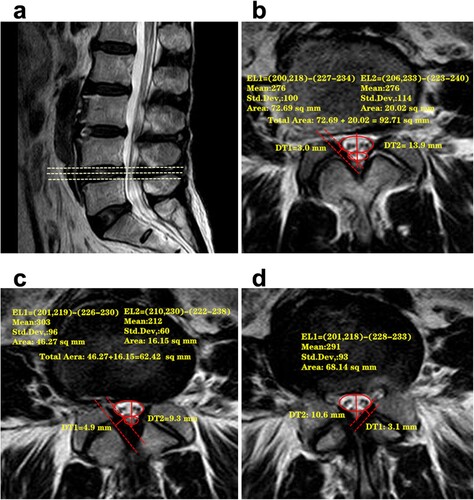
Figure 1. Measurement of the cross-sectional area (CSA) of the dural sac and the posteroanterior diameter (PAD) of the spinal canal. b: Measurement of the thickness of the ligamentum flavum (TLF) and the space of the facet joint (FJ) which can used to evaluate DFJ.
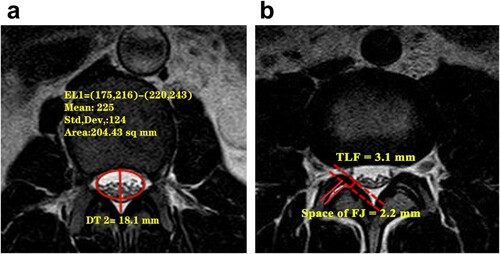
Table 1. Criteria for grading degeneration of the facet joint.
Figure 2. A negative SedSign was defined as having all caudae equinae located in the lower part of the horizontal red dashed line with the exception of the two ventral nerve roots that exit caudal to the level at which the image was taken. b: A positive SedSign was defined as an absence of cauda equina sedimentation, and a ‘squashing’ of the dural sac, with the majority of nerve roots located above the horizontal red dashed line. The horizontal dashed line passes through the midpoint of the posteroanterior diameter of the spinal canal (the red solid line).
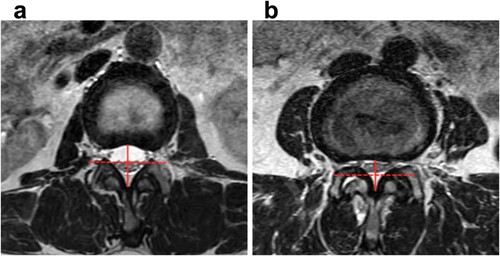
Table 2. The general information of 209 patients with severe LSS.
Table 3. Distribution of a positive SedSign across 290 levels of LSS.
Figure 3. The MRI parameters were evaluated between the positive SedSign group and the negative SedSign group. a: The minimum CSA. b: The minimum PAD. c: The maximum TLF. d: The grade of DFJ. e: The maximum CSAD. *p < 0.05 and **p < 0.01.
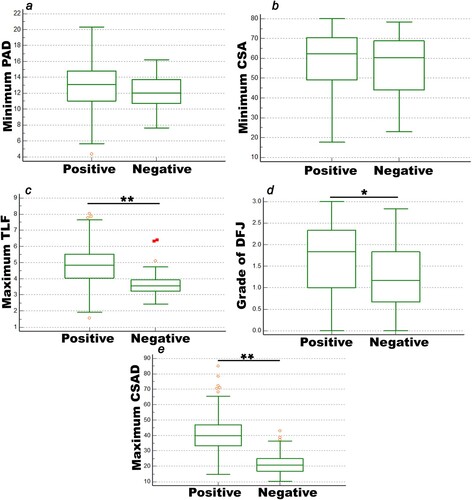
Figure 4. Correlation between the prevalence of a positive SedSign and grade of DF, maximum TLF and CSAD, minimum CSA and PAD. The area under the ROC curve (AUC) for the grade of DFJ was 0.634 (a line, 95% CI: 0.576 − 0.69, p < 0.05). The AUC for maximum CSAD was 0.913 (b line, 95% CI: 0.875 − 0.943, p < 0.01). The AUC for maximum TLF were 0.793 (c line, 95% CI: 0.742 − 0.839, p < 0.01). The AUC for minimum CSA was 0.543 (d line, 95% CI: 0.484 − 0.601, p > 0.05). The AUC for minimum PAD was 0.608 (e line, 95% CI: 0.55 − 0.665, p < 0.05).
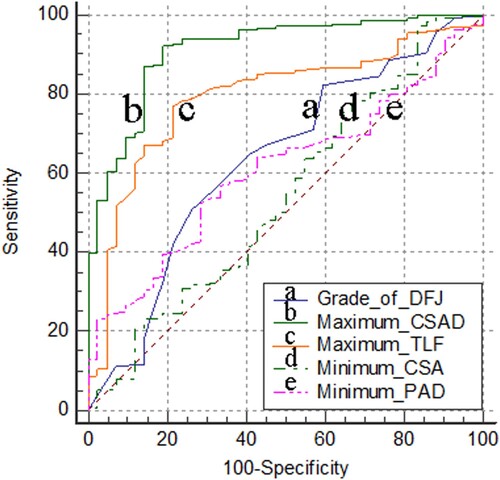
Figure 5. The relationship between a positive SedSign and a change in the CSA of the dural sac at the level of stenosis. a: A sagittal T2-weighted image of L4/5 shows compression of the dural sac because of substantial narrowing in the third MRI scan. b: The first transverse layer of level L4/5, at which point the dural sac was lightly compressed, and there was minimal tendency of the neve roots or cauda equina to move ventrally or toward the center of the spinal canal. A suggestion of a positive SedSign was observed, although not definitively. c: The second transverse layer of level L4/5 OR MR image, at which point the narrowing of the dural sac was increased, the nerve roots were shifted substantially, and a positive SedSign was present. d: The third transverse layer of level L4/5 showed the greatest stenosis. Because of the narrowing of the canal, the nerves were ‘‘squashed’’ and therefore present on both sides of the equator, such that a positive SedSign was apparent.
Data availability statement
The data that support the findings of this study are available in https://data.mendeley.com/datasets/w5p4n7rhwy/1.