
Figures & data
Figure 1. The expression of apoptotic cells in the neurovascular unit of different groups after ischemia/reperfusion. (A) TUNEL and immunofluorescence double staining in neurovascular unit subjected to ischemia/reperfusion in different groups. NeuN/GFAP/CD31 (red), TUNEL (green), DAPI (blue). Scale Bar = 50μm. (B) The number of apoptotic cells in neurovascular unit after ischemia/reperfusion in the left cerebral cortex. (C) The ratio of apoptotic cells in neurovascular unit after ischemia/reperfusion in the left cerebral cortex. Data were expressed as the mean ± SD, n = 3; # P < 0.05 vs the sham group, ## P < 0.001 vs the sham group, *P < 0.05 vs the I/R group, **P < 0.001 vs the I/R group.
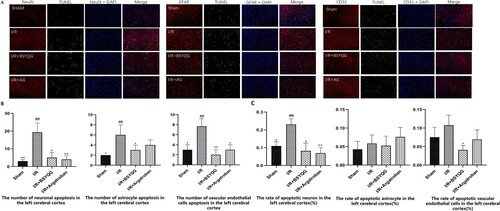
Figure 2. The dynamics of thrombin expression in the cerebral cortex of ischemia/reperfusion rats. (A-B) The immunofluorescence of thrombin in the left ischemic cerebral cortex (A) and the right cerebral cortex (B) subjected to ischemia/reperfusion at different times. Thrombin (red), DAPI (blue). Scale Bar = 50μm. (C-D) Dynamics of thrombin expression in the left ischemic cerebral cortex (C) and the right cerebral cortex (D). Values were expressed as mean ± standard error of the mean (n = 3) in the left cerebral hemisphere. **P < 0.01.
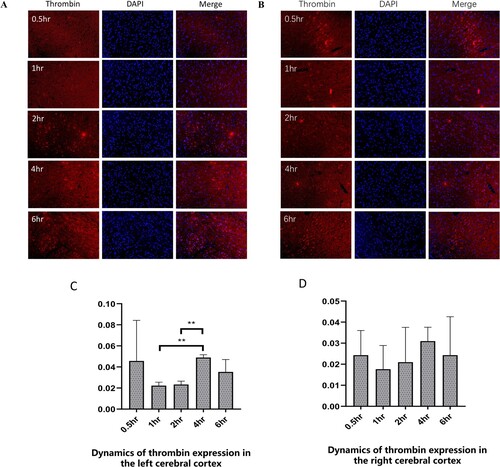
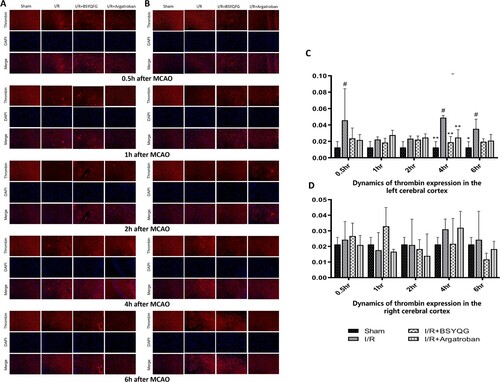
Figure 3. Effects of BSYQG on thrombin expression. (A-B) The immunofluorescence of thrombin in the left ischemic cerebral cortex (A) and the right cerebral cortex (B) subjected to ischemia/reperfusion for different times in different groups. Thrombin (red), DAPI (blue). Scale Bar = 50μm. (C-D) Effects of BSYQG on thrombin expression at different times in the left (C) and right (D) cerebral cortex. The values were expressed as mean ± standard error of the mean (n = 3). #P < 0.05, ##P < 0.001 vs Sham group; *P < 0.05, **P < 0.01 vs I/R group.
Data availability statement
The data that support the findings of this study are available on the figshare website at https://doi.org/10.6084/m9.figshare.19730092.v9