Figures & data
Figure 1. Distribution of study participants.
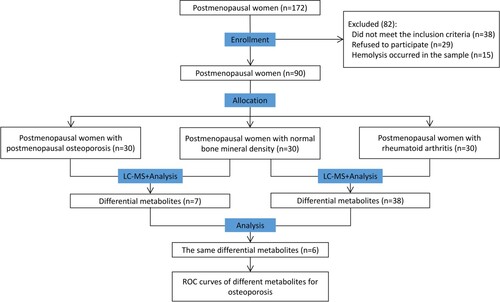
Table 1. General information of the three groups (X±SD).
Figure 2. Univariate analysis: A. Classification of differential metabolites. B. The volcano plot of the PMO group vs the N group in positive ion mode. C. The volcano plot of the PMO group vs the N group in negative ion mode. D. The volcano plot of the RAOP group vs the N group in positive ion mode. E. The volcano plot of the RAOP group vs the N group in negative ion mode (Figure E). In B-E, the red circles indicate high expression, and the blue circles indicate low expression.
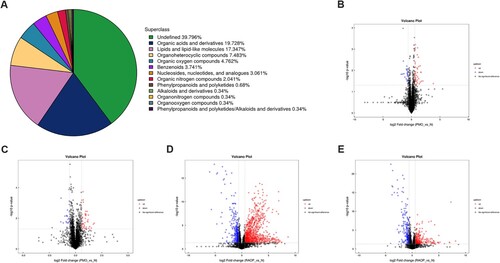
Figure 3. Multidimensional statistical analysis: A. PCA analysis of the PMO group vs the N group in positive ion mode. B. PCA analysis of the PMO group vs the N group in negative ion mode. C. PCA analysis of the RAOP group vs the N group in positive ion mode. D. PCA analysis of the RAOP group vs the N group in negative ion mode. E. PLS-DA analysis of the PMO group vs the N group in positive ion mode. F. PLS-DA analysis of the PMO group vs the N group in negative ion mode. G. PLS-DA analysis of the RAOP group vs the N group in positive ion mode. H. PLS-DA analysis of the RAOP group vs the N group in negative ion mode. I. OPLS-DA analysis of the PMO group vs the N group in positive ion mode. J. OPLS-DA analysis of the PMO group vs the N group in negative ion mode. K. OPLS-DA analysis of the RAOP group vs the N group in positive ion mode. L. OPLS-DA analysis of the RAOP group vs the N group in negative ion mode.
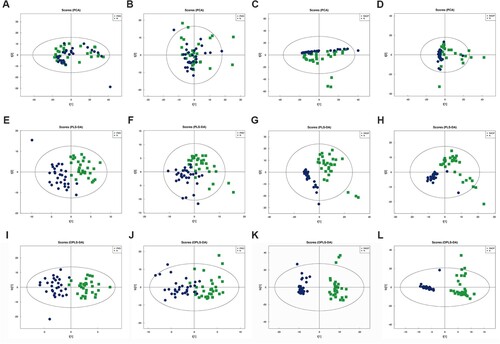
Figure 4. Differential metabolites between the PMO and N groups and those between the RAOP and N groups and comparison of differential metabolite levels among the three groups: A. The Wayne diagram of metabolite set 1 and metabolite set 2. B. Comparison of 2-hydroxy-3-methylbutyric acid levels among the three groups. C. Comparison of dihomo-gamma-linolenic acid levels among the three groups. D. Comparison of epsilon-caprolactam levels among the three groups. E. Comparison of L-leucine levels among the three groups. F. Comparison of L-phenylalanine levels among the three groups. G. Comparison of vanillin levels among the three groups. *p < 0.05, **p < 0.01, ***p < 0.001.
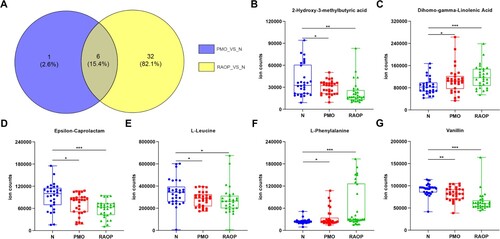
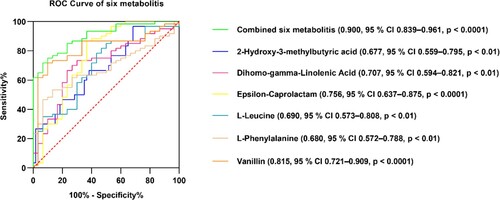
Figure 5. Diagnostic efficacy of the six metabolites. The ROC curves of 2-hydroxy-3-methyl butyric acid, dihomo-gamma-linolenic acid, epsilon-caprolactam, L-leucine, L-phenylalanine, vanillin, and the six metabolites combined.