
Figures & data
Figure 1. RPCvd% and pRNFL thickness in modified Garway-Heath sectors in a normal subject. The Angio Disc radial peripapillary capillary (RPC) enface image was separated by modified Garway-Heath sector grid into 8 sectors by 2 circles with a diameter of 2㎜ and 4㎜. (a) En-face OCT image of the left eye, which is the scan of interest for capillary density measurement. (b) En-face angioflow RPC image of 8 sectors by 2 circles diameter around the ONH. c RPCvd% map. (d) pRNFL thickness map, arcuate regions look like butterfly wings because of warm color code with higher pRNFL thickness.
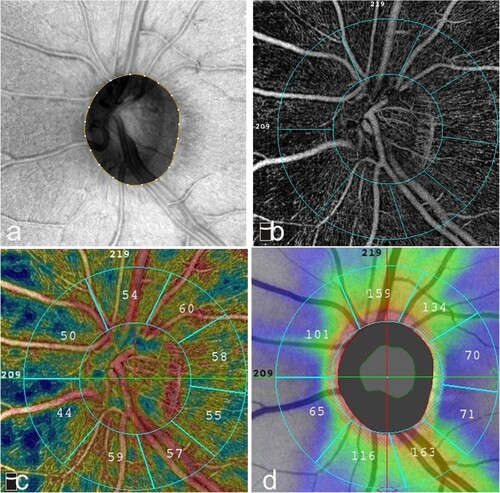
Table 1. Characteristics of the patients included in the study.
Table 2. RPCvd% measurement in patients with active and inactive uveitis and healthy controls: comparison between groups and test post hoc results pairwise.
Table 3. pRNFL thickness measurement in patients with active and inactive uveitis and healthy controls: comparison between groups and test post hoc results pairwise.
Table 4. Differences in patients with anterior and pan uveitis in active phase.
Table 5. Correlation analysis between RPCvd% and pRNFL in active uveitis.
Table 6. Correlation analysis between RPCvd% and pRNFL in inactive uveitis.