Figures & data
Figure 1. L. wallichii extracts attenuated pancreatic, lung, and renal damage in caerulein-induced rats. (A) H&E staining of pancreas tissue from each group showed different levels of tissue damage including pancreatic edema, extravascular infiltration and acinar cell necrosis (×100). (B) Histologic inflammatory score of (A), (G), and (K). (C and D) The activity of serum amylase (C) and lipase (D) in each group (n = 6 per group). (E) Quantification of MPO activity in the pancreas tissues of each group. (F) Quantification of MDA content in the pancreatic tissues of each group. (G) H&E staining of lung tissue from each group presented different levels of tissue damage including thickening of the alveoli, neutrophil infiltration, and alveolar congestion (×200). (H) The level of serum KL-6 in each group (n = 6 per group). (I) Quantification of MPO activity in the lung tissues of each group. (J) Quantification of MDA content in the lung tissues of each group. (K) H&E staining of kidney tissue exhibited identifiable features of kidney injury including typical histological signs of glomerular and tubular damage. (×100). (L, M, and N) Quantification of serum creatinine (L), urea (M) and renal MDA (N) from each group (n = 6 per group). Mean ± SEM, *p < 0.05, **p < 0.01.
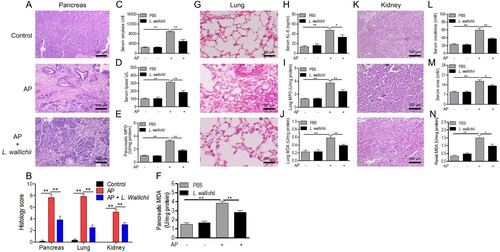
Figure 2. Differential metabolome related to AP and L. wallichii treatment. (A) Hierarchical clustering showing the 74 metabolites. Green and blue present an increase and decrease of metabolites relative to the median metabolite level, respectively (see color scale). (B) Heat map for relative abundances of differential metabolites (n = 60) in the serum of AP-induced rats compared with the control. (C) Heat map for relative abundances of differential metabolites (n = 47) in the serum of AP + L. wallichii-treated rats compared with the serum of AP-induced rats. Green and blue present an increase and decrease of metabolites relative to the median metabolite level, respectively (see color scale). (D) Venn diagram displaying the overlap of differential metabolites between the AP and AP + L. wallichii groups. (E) The number of metabolites up-regulated and down-regulated in different metabolic categories.
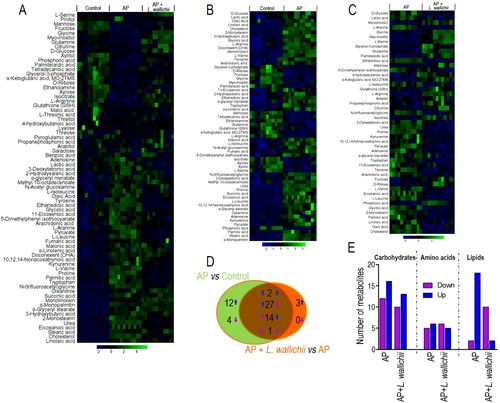
Figure 3. Pathway enrichment analysis and potential metabolic mechanisms of AP-induced injury and anti-AP activity of L. wallichii extracts. (A) ICA directly reveals a variety of metabolites among control, AP, and AP + L. wallichii groups. Each dot in the panel indicates the replicate analysis of samples. (B) By using an online tool, Metaboanalyst 4.0 (http://www.metaboanalyst.ca/), several pathways were enriched. (C) The metabolic flow of serum in AP-induced or AP + L. wallichii–induced rats. Symbol circle and square represent the relative metabolite changes in the AP group and the AP + L. wallichii groups, respectively. The decrease, increase and no change in levels with statistical significance are presented in purple, blue and orange, respectively.
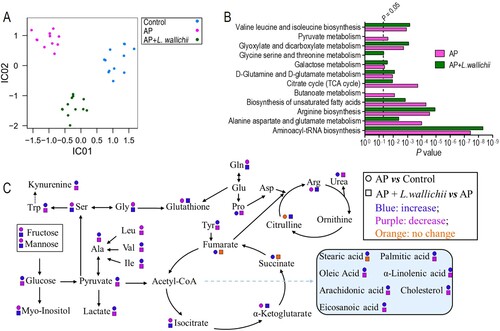
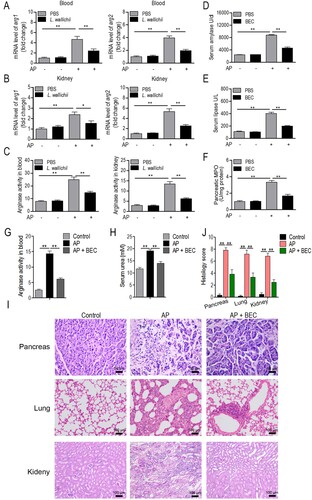
Figure 4. Inhibition of arginase is a potential mechanism for L. wallichii to relieve AP in rats. (A and B) The mRNA level of two arginase (arg1 and arg2) isoforms in the blood (A) and kidney (B) samples that were isolated from caerulein-induced rats treated with or without L. wallichii. (C) The arginase activity in blood and kidney samples that were isolated from caerulein-induced rats treated with or without L. wallichii. (D to F) The impact of a competitive arginase inhibitor, BEC (S-(2-boronoethyl)-L-cysteine), on serum amylase (D), lipase (E), and pancreatic MPO levels (F) of AP-injured rats. (G) The arginase activity in blood samples from caerulein-induced rats treated with or without BEC. (H) Quantification of serum urea from caerulein-induced rats treated with or without BEC. (I) H&E staining of pancreas, lung, and kidney from each group indicated different levels of tissue damage. (J) Histologic inflammatory score calculated from (I). Mean ± SEM, *p < 0.05, **p < 0.01.