Figures & data
Figure 1. Chemical structure of GMA.
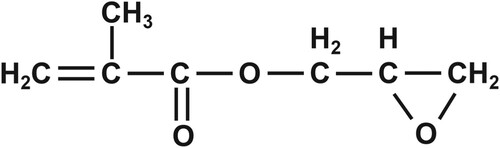
Table 1. Primers and amplicon sizes for selected human genes for RT-PCR.
Figure 2. Soft Agar Colony Formation Assay (A-B). DMSO represents the normal, untransformed cells; GMA-treated represents transformed cells that developed after exposure to four different GMA concentrations. MCA represents the positive control. ** P < 0.01 indicate the cloning efficiency significant difference from control group.
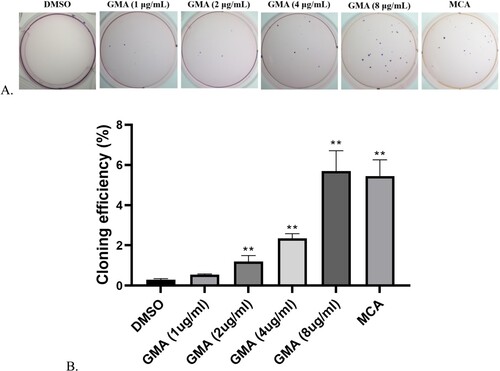
Figure 3. Anchorage-independent growth.
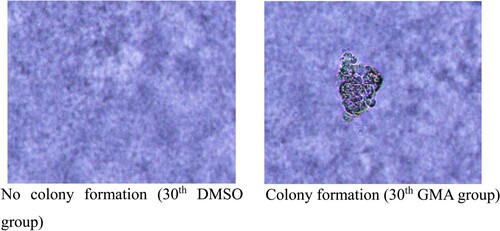
Table 2. Agglutination time of 1st generation cells in Con A.
Table 3. Agglutination time of 10th generation cells in Con A.
Figure 4. Methylation chip scan of 16HBE cells at different time points after malignant transformation by GMA. The first row is for the 10th generation, the second row is for the 20th generation, and the third row is for the 30th generation. Cy5 is labeled red and cy5 labels IP samples, cy3 is labeled green and cy3 labels input samples. Cy5 and cy3 together are detected as yellow.
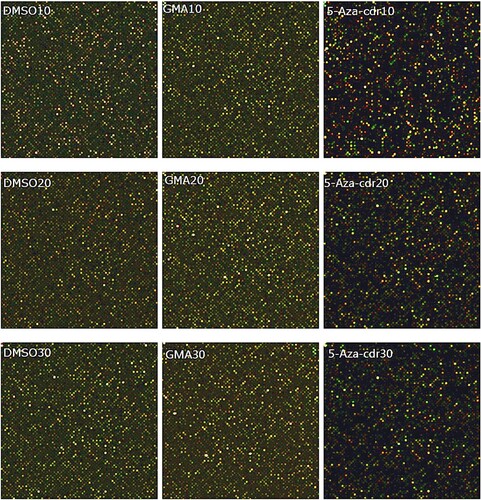
Table 4. DNA methylation silencing genes in the process of 16HBE cells malignant transformation induced by GMA at different time points.
Table 5. Status of DNA methylation-silenced genes throughout the malignant transformation of 16HBE cells stimulated by GMA.
Figure 5. Whole-genome methylation status in 16HBE cells at different time points after malignant transformation by GMA. Methylation levels were determined in untreated control cells and in GMA-treated cells with or without 5-aza-cdr at the 10th, 20th, and 30th generation, by MeDIP coupled with microarray. Expression levels were calculated as a percentage of the control value and presented as the mean ± SD of triplicate tests. *P < 0.05 and **P < 0.01 compared with the untreated control group; #P < 0.05 and ##P < 0.01 compared with the GMA group.
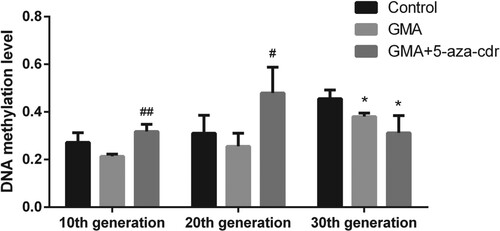
Figure 6. TRPV1/SOD2 methylation status in 16HBE cells at different time points after malignant transformation by GMA. (A-B) TRPV1/SOD2 methylation levels were determined in untreated control cells and in GMA-treated cells with or without 5-aza-cdr at the 10th, 20th, and 30th generation, by MeDIP coupled to microarray. Expression levels were calculated as a percentage of the control value and presented as the mean ± SD of triplicate tests. *P < 0.05 and **P < 0.01 compared with the untreated control group; #P < 0.05 and ##P < 0.01 compared with the GMA group.
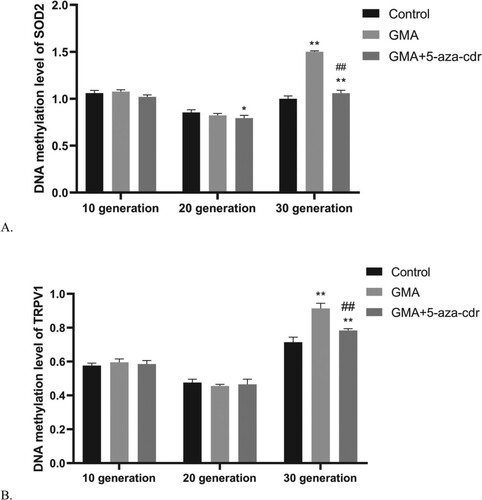
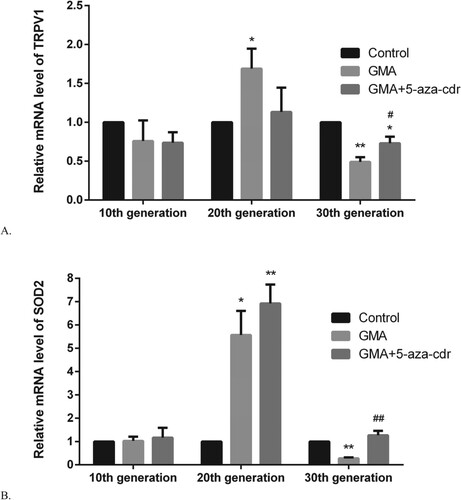
Figure 7. TRPV1/SOD2 mRNA expression levels in 16HBE cells at different time points after malignant transformation by GMA. (A-B) TRPV1/SOD2 mRNA expression levels were determined in untreated control cells and in GMA-treated cells with or without 5-aza-cdr at the 10th, 20th, and 30th generation, by RT-PCR. Expression levels were calculated relative to glyceraldehyde 3-phosphate dehydrogenase gene expression. Values are presented as mean ± SD. *P < 0.05 and **P < 0.01 compared with the untreated control group; #P < 0.05 and ##P < 0.01 compared with the GMA group.