
Figures & data
Table 1. The effects of soil pH, invertase activity, urease activity and cellulase activity in different treatments.
Figure 1. OTU Venn analysis.
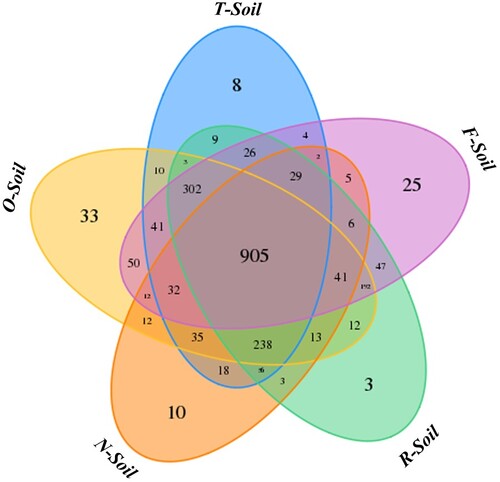
Table 2. Comparison of the estimated richness, diversity indexes and Pielou’s evenness at the operational taxonomic unit (OTU) level.
Figure 2. Comparison of the bacterial communities at the phylum level (‘Other’ means sequences that could not be classified into any known group).
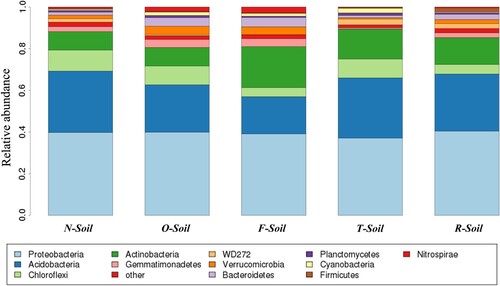
Table 3. The significant different genera among all treatments.
Figure 3. Non-metric multi-dimensional scaling (NMDS) at the genus level.
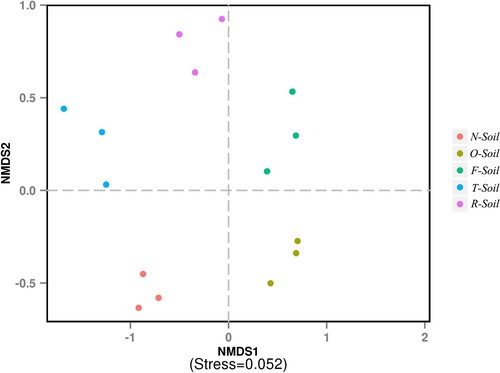
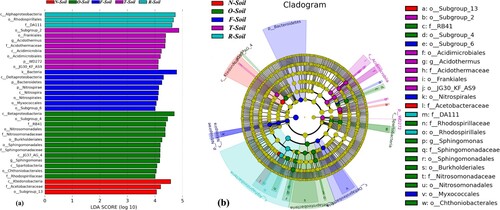
Figure 4. LEfSe results on soil bacterial communities. (a) Histogram of the LDA scores computed for features differentially abundant on different site of tea soil. LEfSe scores can be interpreted as the degree of consistent difference in relative abundance between features of analysed bacterial communities. The histogram thus identifies which clades among all those detected as statistically and biologically differential explain the greatest differences between communities. (b) Taxonomic representation of statistically and biologically consistent differences in different site of tea soil. Differences are represented in the colour of the most abundant class (yellow non-significant, other significantly different). Each circle’s diameter is proportional to the taxon’s abundance.
Supplemental Material
Download MS Word (20.1 KB)Data availability statement
Sequence data are deposited in the National Center for Biotechnology Information (NCBI) Sequence Read Archive (SRA) database [https://www.ncbi.nlm.nih.gov/sra] (PRJNA851941). More details are provided in Data S1 and Data S2. The data that support the findings of this study are available at the figshare repository (https://figshare.com/) at http://doi.org/10.6084/m9.figshare.17162711.v6.