Figures & data
Table 1. Summary data of mass mortality events data between November 2016 to June 2022, according to Sernapesca.
Figure 1. Chilean salmon cumulative mass mortality from February 2016 to June 2022 in tons. Source: Buschman et al. Citation2016; Armijo et al. Citation2020; Chile Citation2022a.
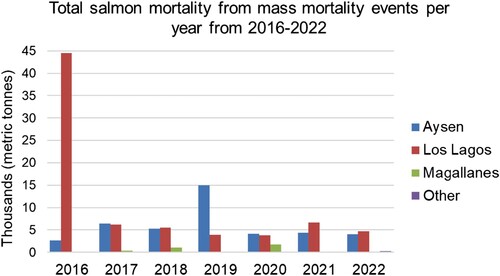
Table 2. Mass mortality events in Chile from 2016 to early 2022, present in media websites and literature.
Figure 2. Overall Map of Chilean salmon showing the location of cumulative mass mortality from November 2016 to June 2022 in tons. Source: Chile Citation2022a.
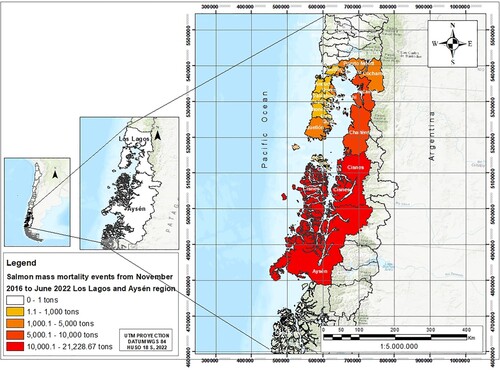
Table 3. Work tasks and activities during MME and hazard exposure to workers in salmon aquaculture.
Figure 3. Literature map of peer-reviewed studies that present empirical evidence of antibiotics, their metabolites, and AMR genetic determinants within open systems salmon aquaculture environments. Source: 3(Tomova et al. Citation2015); 4, 7, 11(Higuera-Llantén et al. Citation2018; Chiesa et al. Citation2019; Salgado-Caxito et al. Citation2022); 1,2,5,6,9(Buschmann et al. Citation2012; Aedo et al. Citation2014; Tomova et al. Citation2018; Domínguez et al. Citation2019; Ramírez et al. Citation2022); 8(Thomassen et al. Citation2022); 10(Muziasari et al. Citation2016); WHO Citation2022. *An absence of cross-sectional studies hinders risk analyses to evaluate human health risks directly associated with AMR genetic determinants in aquaculture environments, represented by large external arrows, particularly during intensive and high-contact operations required during MMEs.
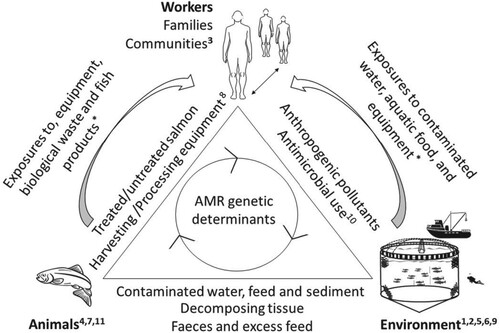
Figure 4. Salmon mass mortality events in the administrative division of Puerto Montt. The circles’ size represents mortality accumulated from November 2016 to June 2022 in each concession. Source: Data from Servicio Nacional de Pesca y Acuicultura (SERNAPESCA) (Chile Citation2022a).
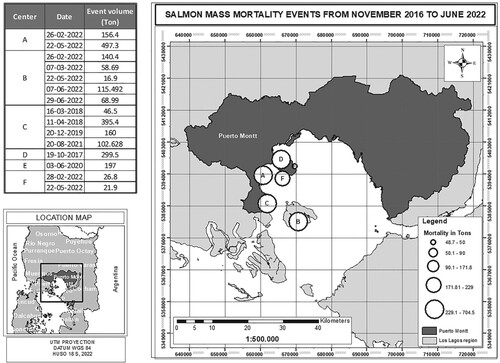
Figure 5. Salmon mass mortality events in the administrative division of Aysén. The circles’ size represents mortality accumulated from November 2016 to June 2022 in each concession. Source: Data from Servicio Nacional de Pesca y Acuicultura (SERNAPESCA) (Chile Citation2022a).
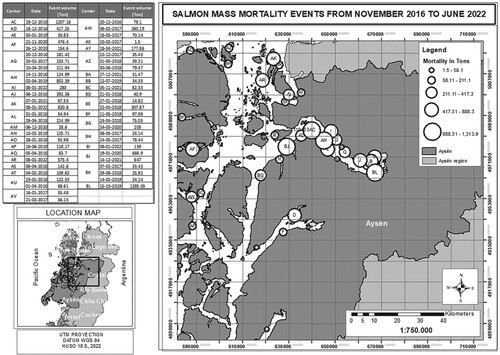
Figure 6. Nearest distance between the aquaculture centers and hospitals (A) and hyperbaric chambers (B) in the region of Los Lagos. Source: developed by authors.
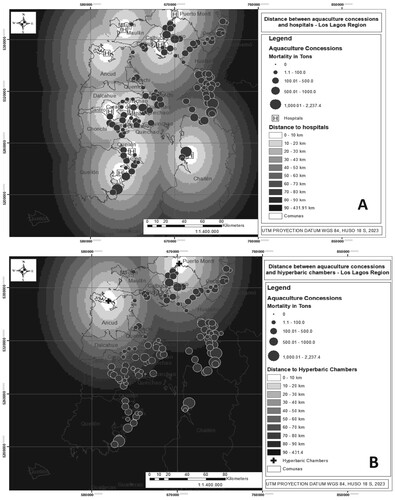
Figure 7. Nearest distance between the aquaculture centers and hospitals (A) and hyperbaric chambers (B) in the region of Aysén. Source: developed by authors.
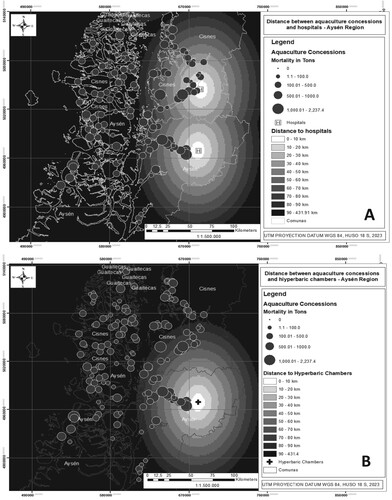
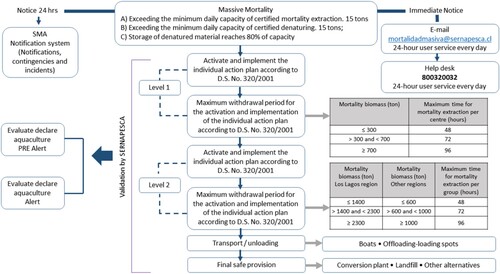
Figure 8. Workflow diagram of measures in the face of mass mortality events. Source: Chile Citation2021a.
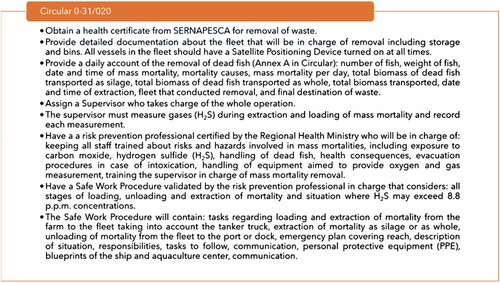
Box 1. Circular 0–31 establishes the safety measures that must be adopted in cases of mass fish mortality. Source: Chile Citation2020a.
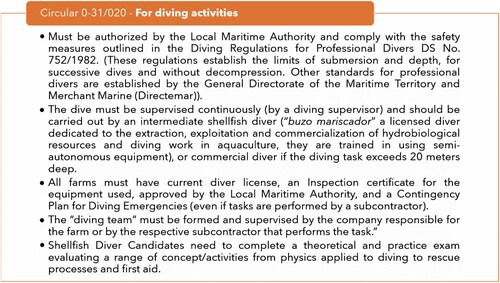
Box 2. Circular 0–31 establishes the safety measures that must be adopted for diving activities. Source: Chile Citation2020a.