
Figures & data
Table 1. Characteristics of the study participants.
Table 2. Medical and treatment characteristics of the CAD group.
Table 3. Comparison of strength of cardiolocomotor coupling and cardiopulmonary exercise testing data.
Figure 1. Relationship between R–R intervals and step intervals of representative participants in the coronary artery disease (CAD) and control groups. The R–R interval and step interval during treadmill walking with progressive load are indicated as dots. The coefficient of determination (R2 value) of the R–R interval and step interval represent the intensity of cardiolocomotor coupling. A and B indicate one representative from the CAD and control groups, respectively. A strong relationship can be observed between the R–R interval and step interval in A.
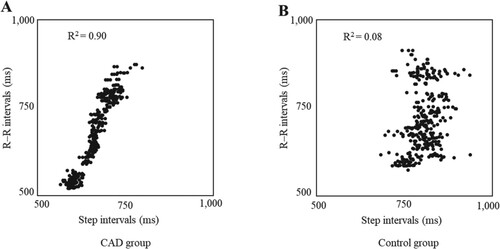
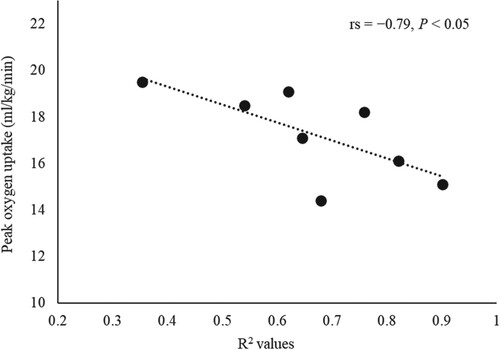
Figure 2. Relationship between the R2 values and peak oxygen uptake in the coronary artery disease group. R2 values represent the intensity of cardiolocomotor coupling. Figure shows a significant negative rank correlation between peak oxygen uptake and R2 values in the coronary artery disease group. Statistics are based on Spearman’s rank correlation coefficient test.
Data availability statement
The data that support the findings of this study are openly available in figshare at https://doi.org/10.6084/m9.figshare.20205683.v2