
Figures & data
Figure 1. Study workflow. lncRNAs: long-chain non-coding RNAs; mRNAs: messenger RNAs; DElncRNAs: differential expression lncRNAs; DEmRNAs: differential expression mRNAs; WGCNA: weighted gene co-expression network analysis; GO: Gene Ontology; KEGG: Kyoto Encyclopedia of Genes and Genomes; DPN: diabetic peripheral neuropathy; MPHT: mechanical pain hypersensitivity test; MNCV: motor nerve conduction velocity; TEM: transmission electron microscope; qRT-PCR: quantitative real-time polymerase chain reaction; DEGs: differential expression genes.
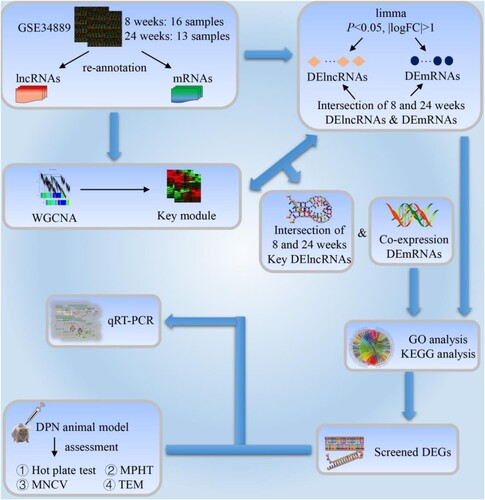
Figure 2. GO and KEGG analysis of differential expression genes. (A) CP showing the relationship between genes and GO of biological process. (B) CP showing the relationship between genes and GO of cellular component. (C) CP showing the relationship between genes and GO of molecular function. (D) CP depicts the relationship between genes and KEGG pathways. GO: Gene Ontology; KEGG: Kyoto Encyclopedia of Genes and Genomes; CP: chord plot.
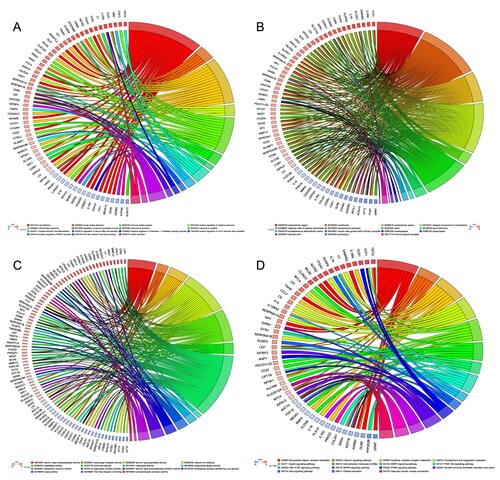
Figure 3. WGCNA analyses and key module selection. (A) Analysis of the scale independence (left) and the mean connectivity (right) for various soft-thresholding powers. (B) Dendrogram of all genes clustered based on a dissimilarity measure. (C) Clustering of module eigengenes. The red line indicates cut height (0.25). (D) The Venn diagram of DIO3OS and Co-DEmRNAs was obtained with different gene sets. A indicates 24 weeks brown module co-expressed mRNAs; B indicates 24 weeks DEmRNAs; C indicates 8 weeks turquoise module co-expressed mRNAs; D indicates 8 weeks DEmRNAs. (E) The Venn diagram of A530053G22Rik and Co-DEmRNAs was obtained with different gene sets. A indicates 24 weeks turquoise module co-expressed mRNAs; B indicates 24 weeks DEmRNAs; C indicates 8 weeks blue module co-expressed mRNAs; D indicates 8weeks DEmRNAs. (F) A heat map drawn with the Co-DEmRNAs with the highest connectivity to DIO3OS. (G) A heat map drawn with the Co-DEmRNAs with the highest connectivity to A530053G22Rik. WGCNA: weighted gene co-expression network analysis; DEmRNAs: differential expression mRNAs; Co-DEmRNAs: co-expressed and differential expression mRNAs.
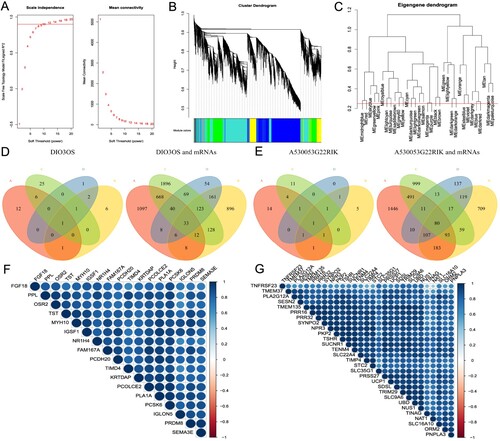
Figure 4. (A) Circular visualization of connectivity, expression patterns, and chromosomal positions of Co-DEGs. Red indicates gene up-regulation, blue represents down-regulation, and white denotes genes not present in a given dataset. The outer circle represents chromosomes; lines coming from each gene point to their specific chromosomal locations. The lncRNAs (DIO3OS and A530053G22Rik) are shown in red. (B) The arrangement pattern diagram of vertebrates shown by DIO3OS on UCSC. (C) The arrangement pattern diagram of vertebrates shown by A530053G22Rik on UCSC. Co-DEGs: co-expressed and differential expression genes; UCSC: University of California Santa Cruz Genome Browser.
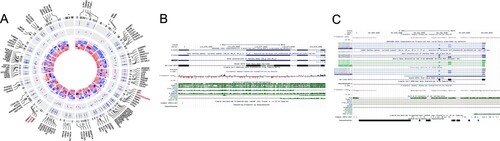
Figure 5. Functional enrichment analyses of Co-DEGs. (A) GO enrichment of DIO3OS Co-DEGs. (B) GO enrichment of A530053G22RIK Co-DEGs. (C) The correlation diagram between DIO3OS and A530053G22RIK. (D) The correlation diagram between DIO3OS and FGF18, DUSP3, DUSP9. (E) The correlation diagram between A530053G22RIK and FGF18, DUSP3, DUSP9. The orange GO terms indicate biological process, the light green GO terms represent cellular component, and the blue GO terms denote molecular function. Co-DEGs: co-expressed and differential expression genes; GO: Gene Ontology.
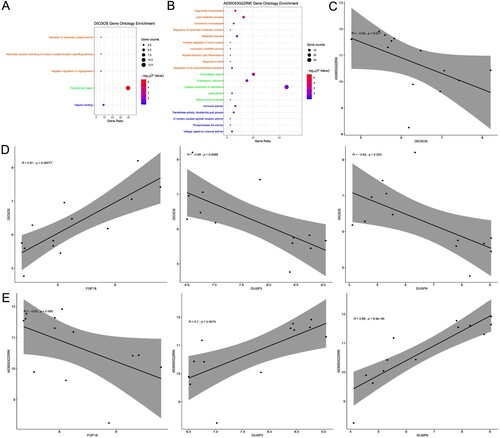
Figure 6. Evaluation of DPN mouse model. (A) body weight. (B) food intake. (C) water intake. (D) urination volume. (E) blood glucose. (F) hot plate test. (G) swinging tail threshold. (H) mechanical pain threshold. (I) MNCV. n = 8 per group, **P < 0.001. DPN: diabetic peripheral neuropathy; SCN: sciatic nerve; MNCV: motor nerve conduction velocity.
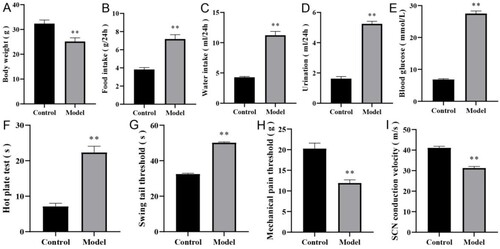
Figure 7. TEM of SCN of mice (A) control group, (B) model group. Magnification × 3000, scale bar = 2 μm. TEM: transmission electron microscope.
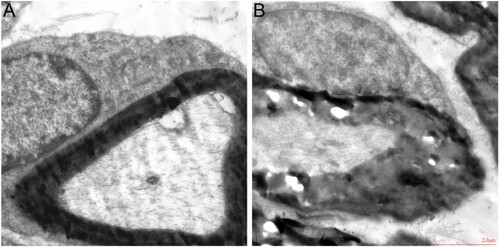
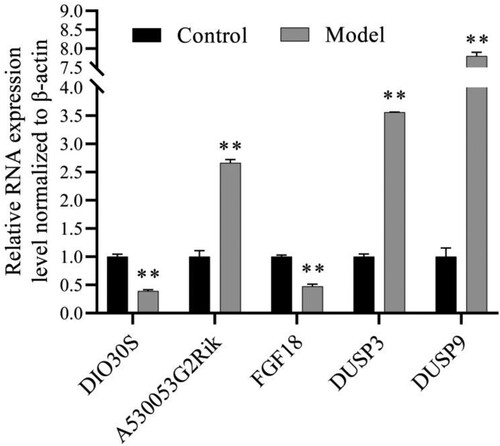
Figure 8. qRT-PCR analyses to validate the results of bioinformatics analyses. **P < 0.001. qRT-PCR: quantitative real-time polymerase chain reaction.
Supplemental Material
Download Zip (5.9 MB)Data availability statement
The data that support the findings of this study are available in Gene Expression Omnibus at https://www.ncbi.nlm.nih.gov/gds, reference number [GSE34889]. The raw data on mice are available at https://doi.org/10.6084/m9.figshare.22723654.v2.