
Figures & data
Figure 1. (a) Pn. (b) Tr. (c) Gs. (d) Ci. Pn: net photosynthesis rate; Gs: stomatal conductance; Tr: transpiration rate; Ci: intercellular CO2 concentration. CK: water + Hoagland nutrient solution; D: water + 15% PEG6000-treated nutrient solutions; D + SA: 0.3 mmol/L SA + 15% PEG6000. Symbols of lower case letters indicate that the significant differences between treatments are at 0.05.
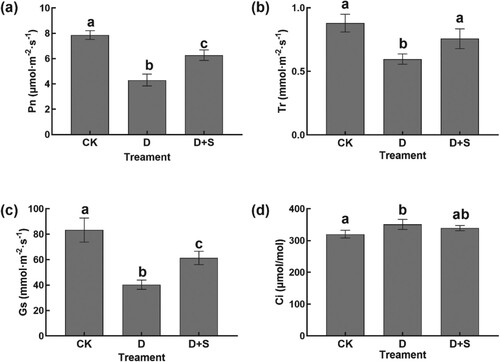
Figure 2. (a) SOD. (b) POD. (c) CAT. (d) MDA. (e) soluble protein. (f) proline. Superoxide dismutase (SOD); Peroxidase (POD); Catalase (CAT). Malondialdehyde (MDA). Symbols of lower case letters indicate that the significant differences between treatments are at 0.05.
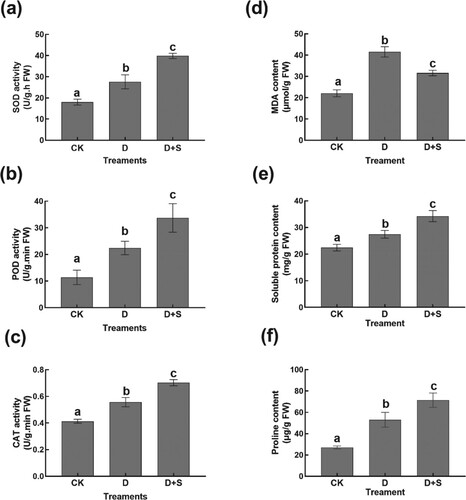
Table 1. Statistics of transcriptome sequencing data.
Figure 3. (a, b) The top 10 GO terms in biological process (BP), cellular component (CC), and molecular function (MF) enriched by differentially expressed genes between different treatments. (c, d) Enrichment analysis of DEGs.
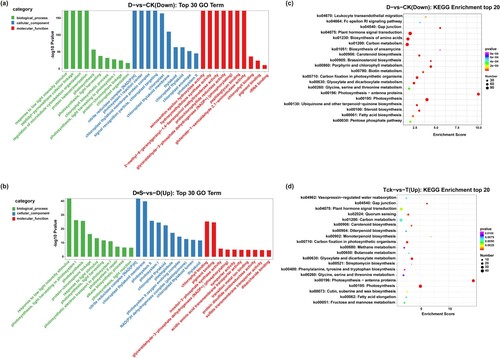
Figure 4. (a). Venn diagram of DEGs between D-vs-CK down and D + S-vs-D up. (b). GO enrichment in DEGs response to SA. (c). KEGG pathway in DEGs response to SA.
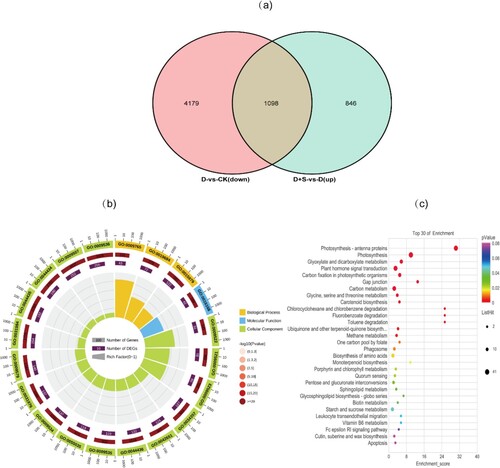
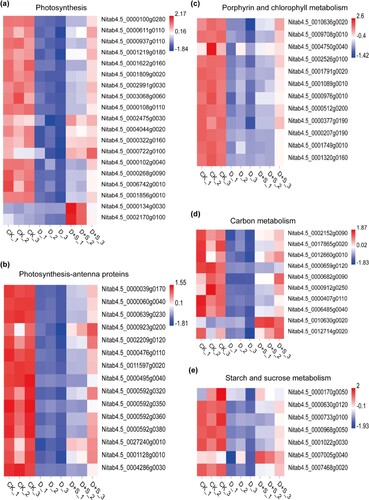
Figure 5. (a) Expression level of genes related to photosynthesis; (b) Expression of genes related to photosynthesis-antenna proteins; (c) Gene expression related to porphyrin and chlorophyll metabolism; (d) Expression levels of genes related to carbon metabolism; (e) Expression pattern of genes related to starch and sucrose metabolism.
Supplemental Material
Download MS Word (482.1 KB)Data availability statement
The sequencing data were deposited in the National Center of Biotechnology Information database (https://www.ncbi.nlm.nih.gov/bioproject/PRJNA747725). The rest of the raw data that support the findings of this study are openly available in Science Data Bank at https://doi.org/10.57760/sciencedb.08474.