
Figures & data
Figure 1. Diagram showing a straight line drawn between a core (A) and a triradius (B) for finger ridge count. Adopted from Gnanasivam and Vijayarajan (Citation2019).
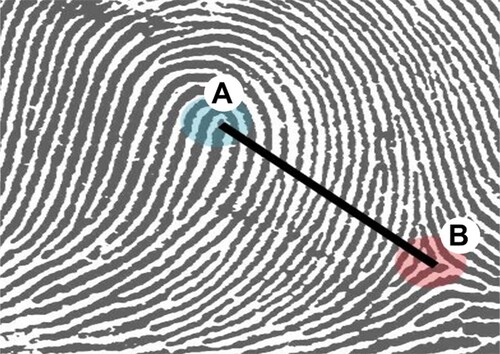
Figure 2. A diagram showing the palmar surface and method of determining the atd angle of the right and left hands. Demonstrated are the four digital triradii (a, b, c, d) located in proximal relation to the bases of the digits I, II, III, and IV (index finger to the little finger, respectively). The lines drawn from the distal ‘t’ triradius to the medial ‘a’ triradius and the lateral ‘d’ triradius form the atd angle (t°). Adapted from Singh et al. (Citation2016).
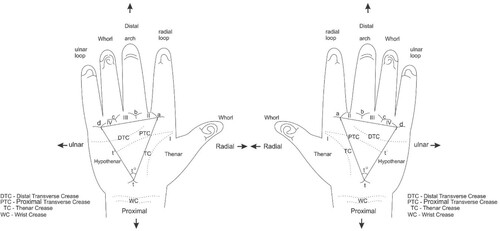
Table 1. Comparison of digito-palmar dermatoglyphic patterns between schizophrenia and control groups and its association with schizophrenia.
Table 2. Comparison of finger ridge count (FRC), triradius, a–b ridge count, and atd angle between patients with schizophrenia and control group.
Data availability statement
Supporting source files and raw data are deposited in Mendeley Data repository as Arko-Boham, Benjamin (2022), ‘Schizophrenia and Digital-Palmar Dermatoglyphics’, Mendeley Data, V6. https://doi.org/10.17632/p2hds3wj2h.6.