
Figures & data
Figure 1. Immune infiltrate landscape of inflamed and uninflamed colitis samples. (A) The bar chart summarizes the percentage of 22 infiltrated immune cells in each sample. (B) Heat map of uninflamed and inflamed UC samples based on immune cell proportions; red, black, and green indicates high, moderate, and low proportions of immune cells, respectively. (C) Differences in the composition of each immune cell type in uninflamed and inflamed UC samples; red represents inflamed samples and blue represents uninflamed samples. (D) Correlation matrix of 22 infiltrating immune cells in the inflamed samples; red represents a positive correlation, blue represents a negative correlation and white represents no correlation between two kinds of cells.
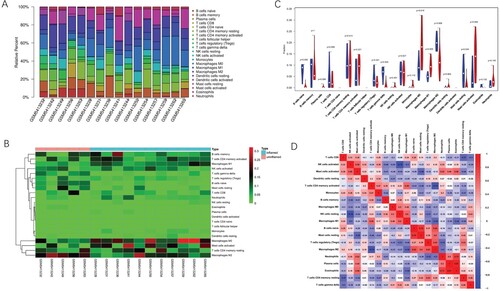
Figure 2. Paired analysis and principal component analysis. (A) M2 macrophages are compared in inflamed and uninflamed mucosa from the same patient. The P values were obtained by the Wilcoxon test. (B) Activated mast cells are compared in inflamed and uninflamed mucosa from the same patient. (C) Resting mast cells are compared in inflamed and uninflamed mucosa from the same patient. (D) Gamma delta T cells are compared in inflamed and uninflamed mucosa from the same patient. (E) PCA results show that the immune cell infiltration analysis can distinguish the inflamed tissues from uninflamed tissues.
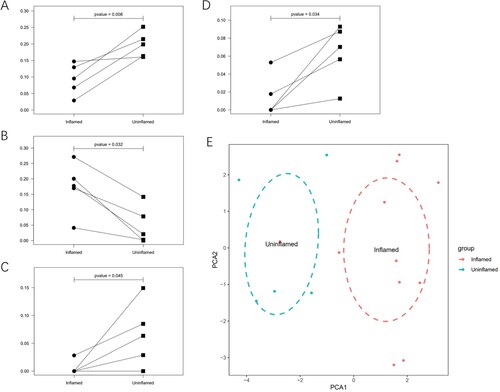
Figure 3. Identification of DEGs and functional enrichment analysis. (A) Heat map of DEGs. Red represents up-regulation genes, blue represents down-regulation genes in the intestinal macrophage population between healthy donors and UC patients. (B) Top 30 clusters DEGs in GO. (C) Top 30 clusters DEGs in KEGG.
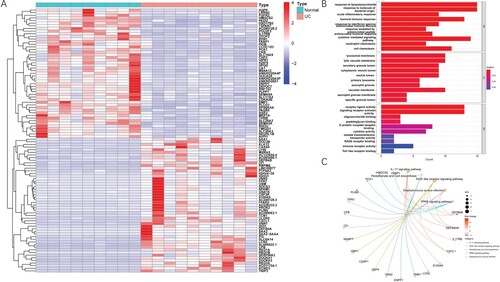
Figure 4. Identification of hub gene candidates and PPI network. (A) The interaction network of DEGs is plotted, disconnected nodes are hidden. (B) The number of adjacent nodes of the top 30 genes.
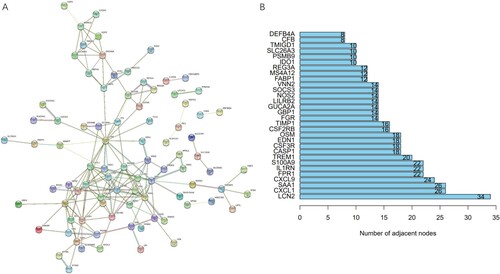
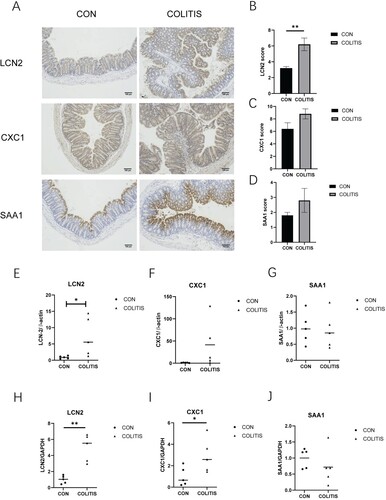
Figure 5. The expression of hub gene candidates in mouse colitis tissue. (A) Immunohistochemical staining with LCN2, CXCL1 and SAA1; scale label is 100 μm. (B–D) Immunohistochemical score of three hub gene candidates. (E–G) The expression levels of LCN2, CXCL1, and SAA1 were relative to β-actin. (H–J) The expression levels of LCN2, CXCL1, and SAA1 were relative to GAPDH. Data are presented as mean ± SEM (n = 5 in each group), **p < 0.01, unpaired t-test was used.
Supplemental Material
Download MS Word (52.4 KB)Data availability statement
The data that support the findings of this study are available in the GEO database at https://www.ncbi.nlm.nih.gov/geo/query/acc.cgi?acc = GSE179285, https://www.ncbi.nlm.nih.gov/geo/query/acc.cgi?acc = GSE123141, including the platforms and supplementary file. The raw data of IHC and RT-qPCR was deposited at https://figshare.com with a DOI link https://doi.org/10.6084/m9.figshare.21511677.