
Figures & data
Table 1. Primer’s sequence
Figure 1. The expression of MCT1. (A) MCT1 expression in multiple cell populations in the kidneys of Mouse UUO d14 dataset by using an online analyzer for kidney single cell datasets Kidney Interactive Transcriptomics. (B) Representative immunohistochemical staining images of MCT1 in obstructed kidneys (n = 3). (C-D) Western blot and of semiquantitative analysis of MCT1 in UUO mice (n = 3). The values represent means ± SEM.
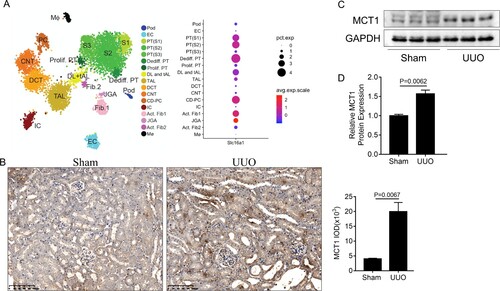
Figure 2. α-CHCA ameliorated histologic changes induced by UUO. (A) Deposition of total fibrosis in kidney tissues was determined by Masson's trichrome staining (×200). (B) The relative fibrotic area (%), based on Masson's trichrome staining. Scale bar, 50 µm. The values represent means ± SEM (n = 6-8). For the UUO group vs. the sham group, *indicates P < 0.05.
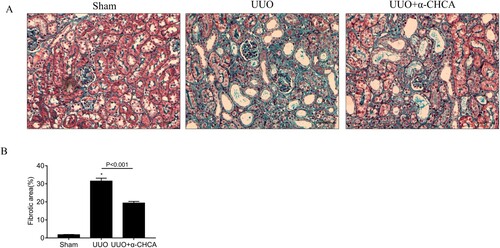
Figure 3. α-CHCA reduced renal interstitial fibrosis in UUO animals. (A) qPCR analysis of FN1, collagen I, collagen III and TGF-β1 (n = 6-8). (B) Western blot of FN1 and TGF-β1 (n = 4 per group). (C) Semiquantitative analysis of average optical density of FN1 and TGF-β1 (n = 4 per group). The values represent means ± SEM. For the UUO group vs the sham group, *indicates P < 0.05.
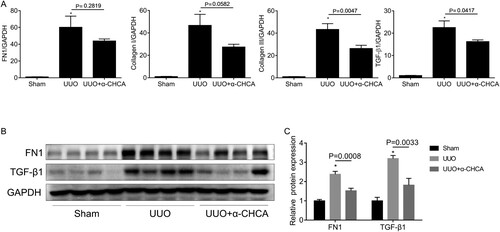
Figure 4. α-CHCA ameliorated renal inflammation in UUO animals. (A) HE staining of the kidney tissues. (B-D) qPCR analysis of MCP-1, TNF-α and IL-6 (n = 6-8). The values represent means ± SEM. For the UUO group vs the sham group, *indicates P < 0.05.
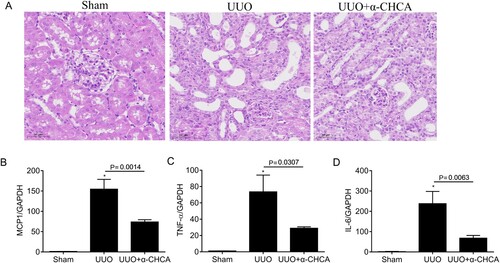
Figure 5. α-CHCA suppressed TGF-β1-induced fibrotic response in mPTCs at the mRNA level. (A) CCK8 assay of the cell viability after treatment with different concentrations of α-CHCA. (B-E) qPCR analysis of FN1, collagen I, collagen III and α-SMA (n = 6 per group). mPTCs were pre-treated α-CHCA (1.25 mM) for half an hour, then treated with TGF-β1 (15 ng/ml) for 24 h. The values represent means ± SEM. For the TGF-β1 group vs the control group, *indicates P < 0.05.
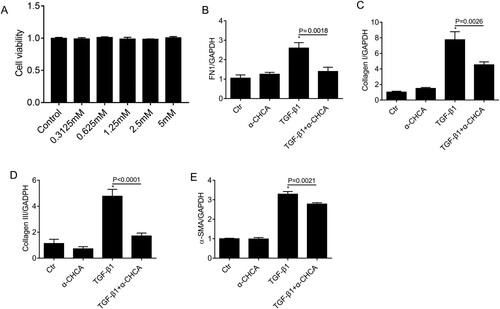
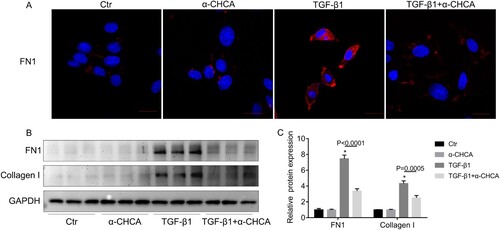
Figure 6. α-CHCA suppressed TGF-β1-induced fibrotic response in mPTCs at the protein level. (A) Immunofluorescence staining of FN1. (B) Western blots of FN and collagen I. (C) Semiquantitative analysis of average optical density of FN1 and collagen I (n = 3 per group). mPTCs were pre-treated α-CHCA (1.25 mM) for half an hour, then treated with TGF-β1 (15 ng/ml) for 24 h. The values represent means ± SEM. For the TGF-β1 group vs the control group, *indicates P < 0.05.
Data availability statement
All necessary experimental raw data were uploaded to Zenodo Database via link below https://doi.org/10.5281/zenodo.7851522.