Figures & data
Figure 1. Sample tree clustering of transcriptional profile of 53 intestinal mucosa biopsies and corresponding and clinical traits. Disease state: black indicates CD patients, and white indicates patients without CD. Inflammation: black indicates the tissues with inflammation, and white indicates the tissues without inflammation.
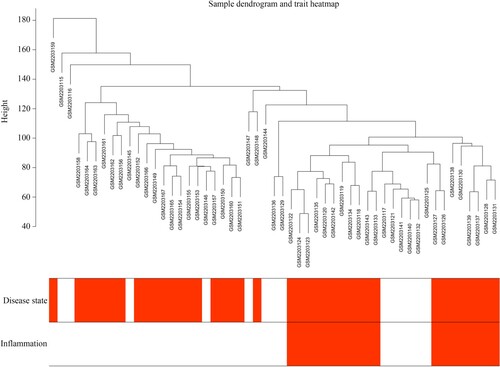
Figure 2. Construction of WGCNA. (A,B) Scale independence and mean connectivity of various soft threshold values (β). β with the scale independence >0.85 and mean connectivity closed to 0 was set as suitable. (C) Gene sets with the corresponding log10 and log10 P-values when the scale-free topology is set as β = 14. (D) Clustering dendrograms of all genes with dissimilarities based on topological overlap, together with their assigned module colors.
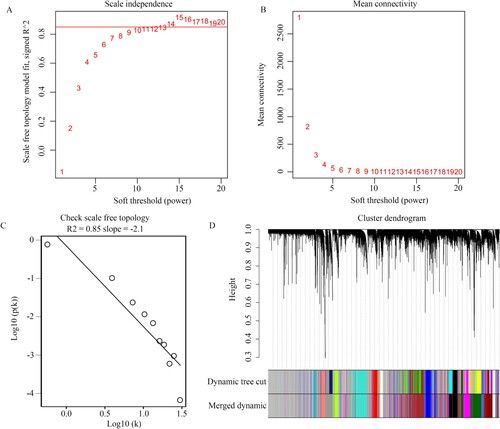
Figure 3. Identification of clinical modules. (A) Heatmap showing the relationship between gene modules and clinical traits. (B) The relationship between module memberships of clinically significant modules and gene significance of inflammation and disease state are shown.
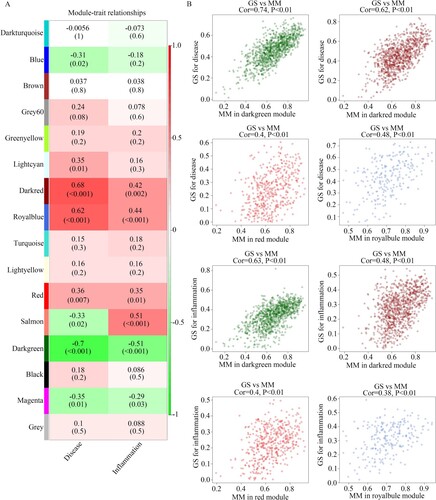
Figure 4. Identification of differently expressed genes in intestinal mucosa biopsies obtained from healthy controls and CD patients with or without inflammation. (A) Volcano plot showing the differently expressed genes in the intestinal mucosa biopsies obtained from healthy controls and CD patients with the threshold as LogFC ≥ 1. (B) Volcano plot showing the differently expressed genes in the intestinal mucosa biopsies with or without inflammation obtained from CD patients with the threshold as LogFC ≥ 1. (C) Intersection analysis was performed to identify differently expressed genes which were also clustered in the clinical modules. List 1: differently expressed genes in the intestinal mucosa biopsies obtained from healthy controls and CD patients. List 2: the differently expressed genes in the intestinal mucosa biopsies with or without inflammation obtained from CD patients. List 3: Genes in the clinical modules. (D) PPI network of SCIN, TMEM61, SLC39A5, CYP2S1, and CDHR5.
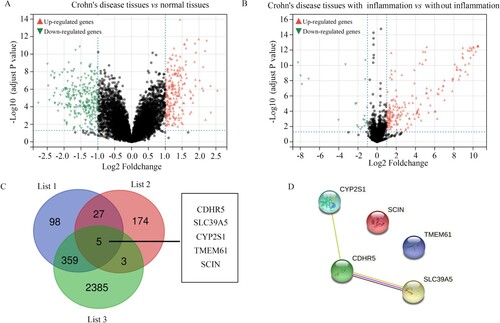
Table 1. The change level of SCIN, TMEM61, SLC39A5, CYP2S1 and CDHR5 among intestinal mucosa biopsies from healthy control, intestinal mucosa biopsies with inflammation from CD patients and intestinal mucosa biopsies without inflammation based on the data from GSE83448.
Figure 5. SCIN, TMEM61, SLC39A5, CYP2S1, and CDHR5 expression in the intestinal mucosa biopsies obtained from healthy controls and CD patients based on the data from GSE208303.
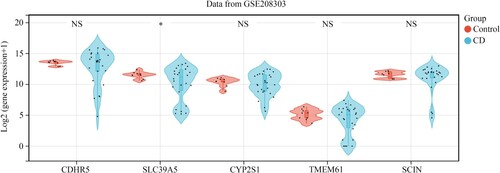
Figure 6. Clinical value of SLC39A5. (A) SLC39A5 expression in the 31 pair CD tissues and adjacent mucosa biopsies. (B,C) Matched-pair analysis for SLC39A5 expression between CD tissues and corresponding adjacent mucosa biopsies. (D) Pearson analysis for the relationship between SLC39A5 mRNA levels in CD tissues and SES-CD score. (E) Representative protein levels of SLC39A5 in 5 pair CD tissues and adjacent tissues determined by western blot. **P < 0.05.
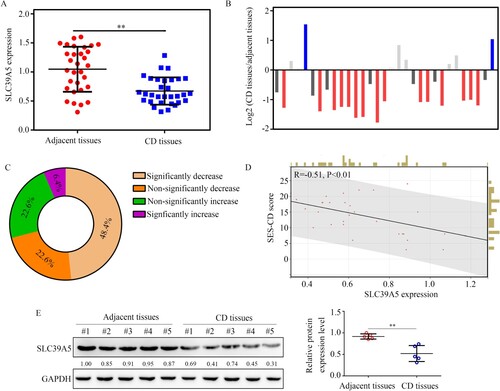
Table 2. The basic clinical traits of 31 CD patients who provided intestinal mucosa biopsies and expression of SLC39A5 in adjacent tissues and CD tissues.
Table 3. Fisher’s exact test was used to analyze the relationship between SLC39A5 expression in CD tissues and clinical traits of 31 CD patients.
Figure 7. GSEA for SLC39A5 in CD tissues. (A) Pathways activated in the CD tissues with low SLC39A5 expression. (B) Pathways inhibited in the CD tissues with low SLC39A5 expression.
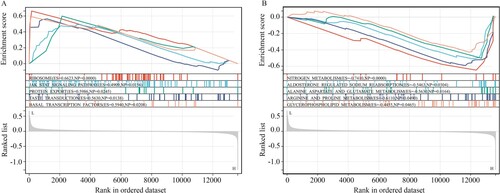
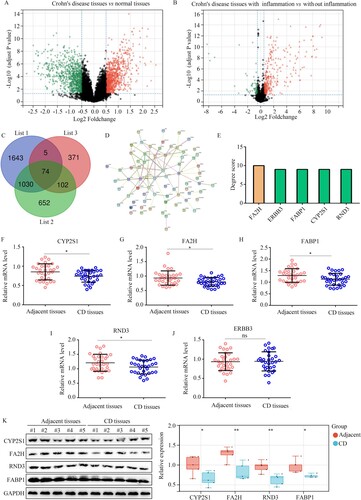
Figure 8. CYP2S1, FA2H, FABP1, and RND3 were identified as biomarkers for CD while broadening the threshold of bioinformatics analysis. (A) Volcano plot showing the differently expressed genes in the intestinal mucosa biopsies obtained from healthy controls and CD patients, with the threshold as LogFC ≥ 0.5. (B) Volcano plot showing the differently expressed genes in the intestinal mucosa biopsies, with or without inflammation, obtained from CD patients, with the threshold as LogFC ≥ 0.5. (C) Intersection analysis was performed to identify differently expressed genes, which were also clustered in the clinical modules. List 1: Genes in the clinical modules. List 2: the differently expressed genes between the intestinal mucosa biopsies with or without inflammation from CD patients. List 3: differently expressed genes between the intestinal mucosa biopsies provided by healthy controls and those from CD patients. (D,E) Construction of PPI network of the 74 genes, and selection of hub genes in PPI network based on degree score. (F–J) qRT-PCR analysis was performed to analyze the expression of CYP2S1, FA2H, FABP1, RND3, and ERBB3 in CD tissues and adjacent tissues. (K) Western blotting analysis was performed to analyze the expression of CYP2S1, FA2H, FABP1, and RND3 in CD tissues and adjacent tissues. **P < 0.01; *P < 0.05; ns, not significant.