
Figures & data
Figure 1. The flowchart of the whole study.
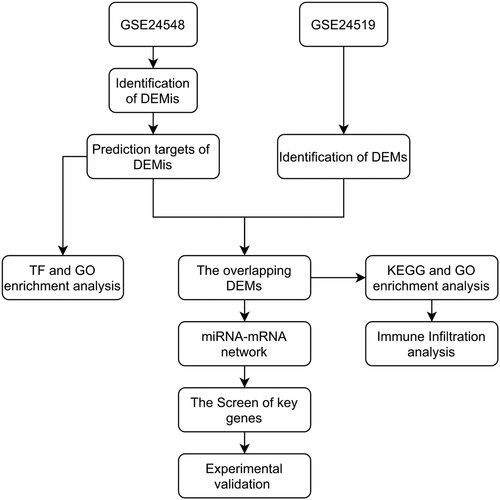
Figure 2. The screening results of DEMis. (A) Volcano plot of differentially expressed miRNAs (|log2FC| > 0.5, adjusted P < 0.05). (B) The differential expression heatmap of miRNAs.
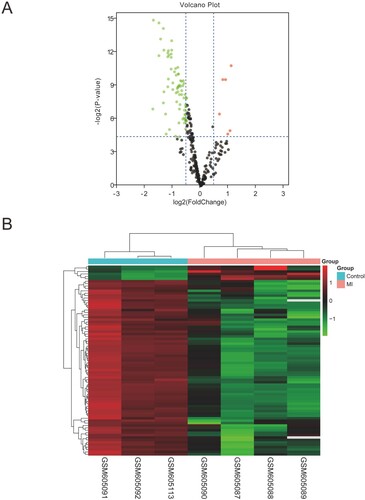
Figure 3. GO and transcription factor enrichment analysis of DEMis. (A) The transcription factor enrichment analysis of DEMis. (B) The cellular component terms related to DEMis in GO enrichment analysis. (C) The biological process terms related to DEMis in GO enrichment analysis. (D) The molecular function terms related to DEMis in GO enrichment analysis.
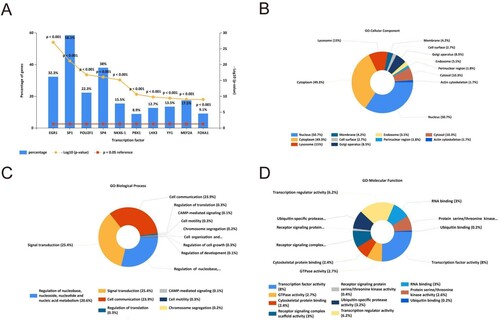
Table 1. The differentially expressed miRNAs.
Figure 4. The screening results of DEMs. (A) Volcano plot of differentially expressed mRNAs (|log2FC| > 0.5, adjusted P < 0.05). (B) The differential expression heatmap of mRNAs. (C and D) Venn diagram was drawn to show the overlapping genes between up-/down-regulated miRNA targets and up-/down- regulated mRNAs.
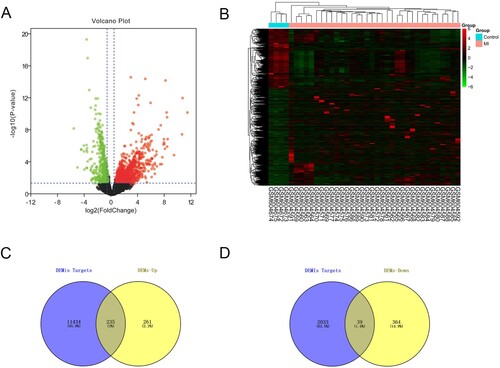
Figure 5. Construction of miRNA-mRNA network. (A) The network of all the DEMis and DEMs. (B) The top 10 genes with shortest paths in the betweenness algorithm analysis. (C) The top 10 genes with shortest paths in the closeness algorithm analysis. (D) The top 10 genes with shortest paths in the degree algorithm analysis. (E) The overlapping genes of betweenness, closeness, and degree analysis results.
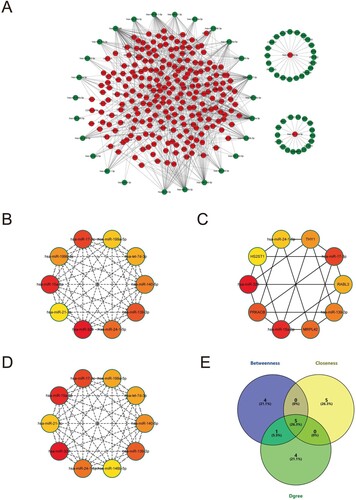
Table 2. The overlapping miRNAs of Degree, Closeness, and Betweenness algorithm analysis.
Figure 6. The final ceRNA network and its sub-network. (A) The final ceRNA network consisted of 5 miRNAs and their targets. (B) The key module of final network.
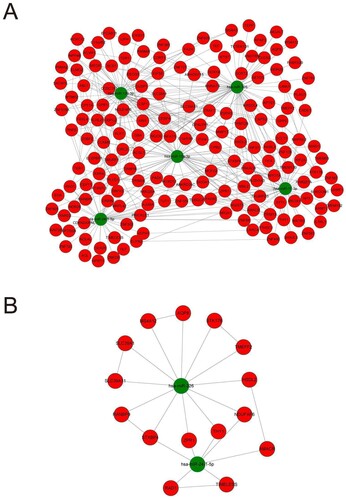
Figure 7. GO and pathway analysis of DEMS in the miRNA-mRNA network. (A) The top 10 pathways related to DEMs were shown in the bubble chart. (B) The biological process terms related to DEMs in GO enrichment analysis. (C) The cellular component terms related DEMs in GO enrichment analysis. (D) The molecular function terms related DEMs in GO enrichment analysis.
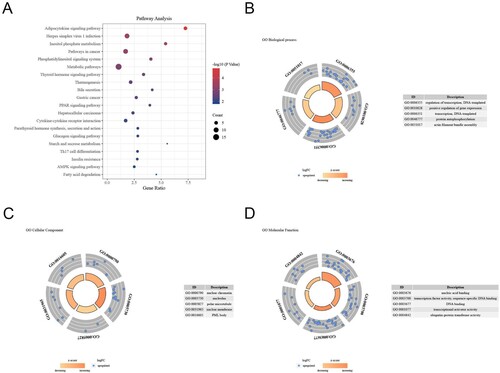
Figure 8. Immune analysis of GSE24519: (A) The proportion of immune cells. (B) The difference analysis of immune cell enrichment scores between MI and normal tissues. (C) The correlation analysis between hub genes and specific immune cells.
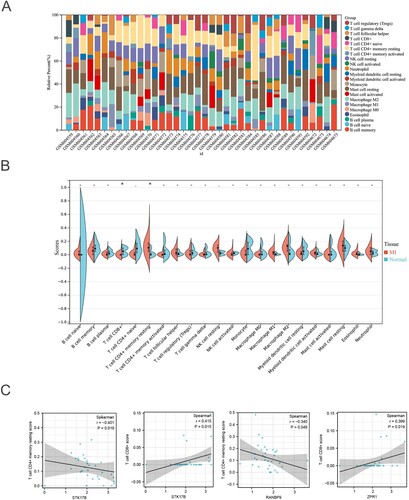
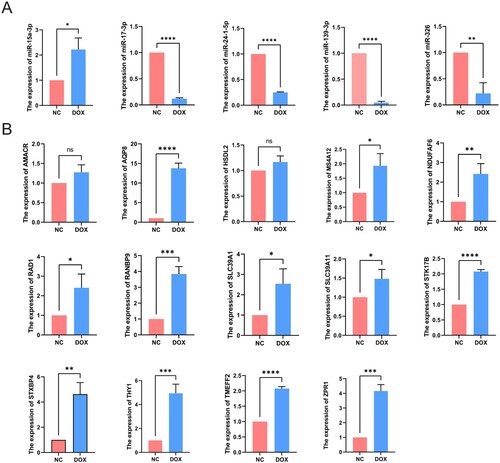
Figure 9. Validation of DEMis and DEMs expression. (A) The qRT-PCR results of key miRNAs. (B) The qRT-PCR results of key mRNAs.
Supplemental Material
Download Zip (489.3 KB)Data availability statement
The microarray data that support the findings of this study are available in the Gene Expression Omnibus database at https://www.ncbi.nlm.nih.gov/geoprofiles. The data of experiments in this study are included in the Figshare database (https://doi.org/10.6084/m9.figshare.20280393.v1).