
Figures & data
Table 1. Primer sequence of BRAF gene for DHPLC and Sanger sequencing.
Table 2. Primer sequence of SMO gene.
Figure 1. (A). PCR amplification of exon 15 of BRAF gene. M: DNA marker, 1: negative control, 2: gingiva, 3–7: ameloblastoma specimens; (B). DHPLC chromatograms of exon 15 of BRAF gene with no mutation: negative control; (C). DHPLC chromatograms of exon 15 of BRAF gene with V600E mutation: positive control; (D). DHPLC chromatograms of exon 15 of BRAF gene in normal gingiva; (E). DHPLC chromatograms of exon 15 of BRAF gene mutation in ameloblastoma specimens; (F). Sequencing analysis of exon 15 of BRAF gene in normal gingiva (arrow, GTG); (G). Sequencing analysis of exon 15 of BRAF gene in ameloblastoma specimens (arrow, GAG). PCR, polymerase chain reaction
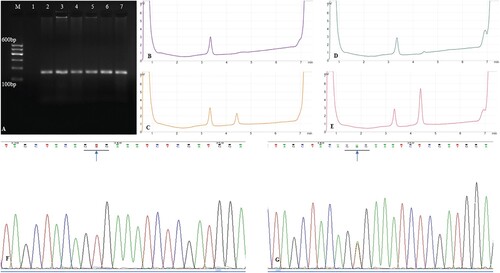
Figure 2. (A). PCR amplification of exon 3 of SMO gene. M: DNA marker, 1: negative control, 2: gingiva, 3–7: ameloblastoma specimens; (B). PCR amplification of exon 5 of SMO gene. M: DNA marker, 1: negative control, 2: gingiva, 3–7: ameloblastoma specimens; (C). PCR amplification of exon 6 of SMO gene. M: DNA marker, 1: negative control, 2: gingiva, 3–7: ameloblastoma specimens; (D). PCR amplification of exon 10 of SMO gene. M: DNA marker, 1: negative control, 2: gingiva, 3–7: ameloblastoma specimens; (E). PCR-SSCP analysis of exon 3 of SMO gene. M: DNA marker, 1: negative control, gingiva: 2–8: ameloblastoma specimens. The result of lane 3 cannot be interpreted. Abnormal migrational bands (white arrow); (F). PCR-SSCP analysis of exon 5 of SMO gene. M: DNA marker, 1: negative control, gingiva: 2–8: ameloblastoma specimens. Abnormal migrational bands (white arrow); (G). PCR-SSCP analysis of exon 6 of SMO gene. M: DNA marker, 1: negative control, gingiva: 2–8: ameloblastoma specimens. Abnormal migrational bands (white arrow)’; (H). PCR-SSCP analysis of exon 10 of SMO gene. M: DNA marker, 1: negative control, gingiva: 2–8: ameloblastoma specimens. Abnormal migrational bands (white arrow). PCR-SSCP, polymerase chain reaction-single-strand conformation polymorphism; PCR, polymerase chain reaction
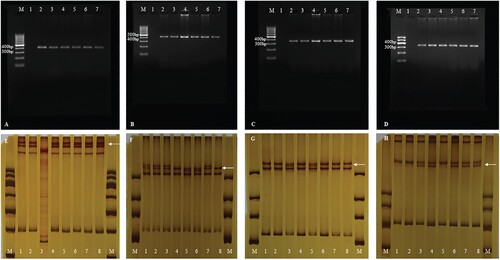
Figure 3. (A). Sequencing analysis of exon 2 of SMO gene in wild type ameloblastoma specimens; (B). Sequencing analysis of exon 2 of SMO gene in mutated ameloblastoma specimens (blue arrow, GAA→GAG); (C). Sequencing analysis of exon 3 of SMO gene in wild type ameloblastoma specimens; (D). Sequencing analysis of exon 3 of SMO gene in mutated ameloblastoma specimens (blue arrow, GAA→GAG); (E). Sequencing analysis of exon 5 of SMO gene in wild type ameloblastoma specimens; (F). Sequencing analysis of exon 5 of SMO gene in mutated ameloblastoma specimens (blue arrow, GCG→GCA).
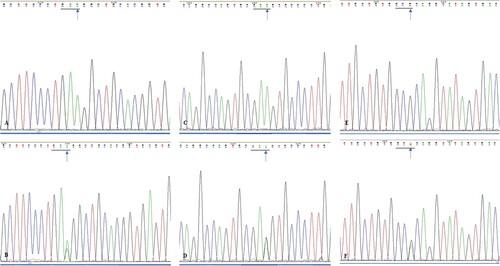
Figure 4. (A). Sequencing analysis of exon 5 of SMO gene in wild type ameloblastoma specimens; (B). Sequencing analysis of exon 5 of SMO gene in mutated ameloblastoma specimens (blue arrow, ACC→AAC); (C). Sequencing analysis of exon 6 of SMO gene in wild type ameloblastoma specimens; (D). Sequencing analysis of exon 6 of SMO gene in mutated ameloblastoma specimens (blue arrow, GGC→GGG); (E). Sequencing analysis of exon 10 of SMO gene in wild type ameloblastoma specimens; (F). Sequencing analysis of exon 10 of SMO gene in mutated ameloblastoma specimens (blue arrow, AGC→ACC).
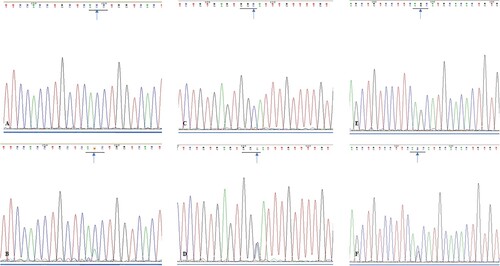
Table 3. SMO gene mutations in ameloblastoma.
Table 4. Relation between BRAF gene mutations and clinical pathology in 30 cases.
Table 5. Relation between SMO gene mutations and clinical pathology in 30 cases.
Data availability statement
The data that support the findings of this study are available in the Zenodo repository at https://doi.org/10.5281/zenodo.8267153.