
Figures & data
Figure 1. Identification of ovarian cancer (OC)-related differentially expressed genes (DEGs). (A) Volcano plots of DEGs between tumor and normal samples. Blue represents downregulated DEGs, red represents upregulated DEGs. (B) Venn diagram of the DEGs and ovarian disease-related genes.
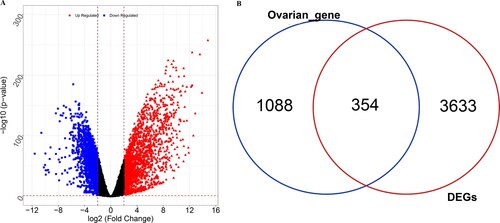
Figure 2. Functional enrichment analysis of DEGs. (A) Top 20 enriched Gene Ontology (GO) terms and Kyoto Encyclopedia of Genes and Genomes (KEGG) pathways. (B) Network of enriched GO terms and KEGG pathways. Different node colors indicate different clusters, and the lines indicate similarities among genes annotated with each term.
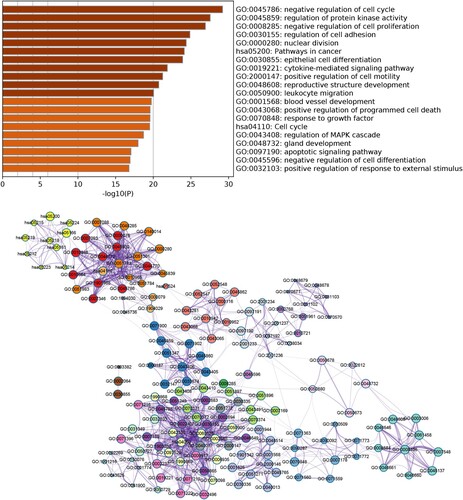
Figure 3. Protein-protein interaction (PPI) network. Different colors indicate the different modules identified using Molecular Complex Detection (MCODE). Triangles and inverted triangles indicate the upregulated and downregulated genes, respectively. Node size indicates the degree of connectivity, and gray lines represent interactions between proteins.
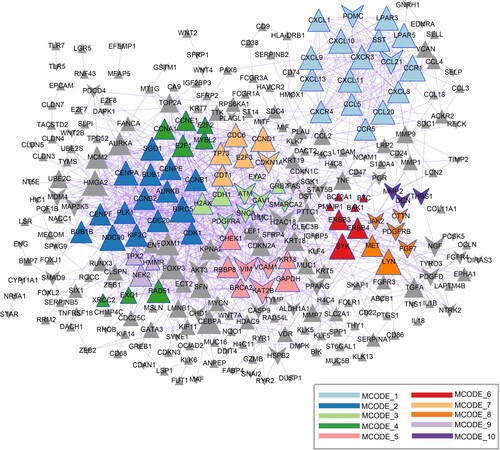
Table 1. The GO-BP function and KEGG pathway of DEGs in 10 modules extracted from PPI network.
Figure 4. Gene-drug interaction network (A) and drug-pathway network (B). (A) Red triangles indicate upregulated genes; green inverted triangles indicate downregulated genes; gray rectangles indicate predicted drugs. (B) Yellow squares indicate KEGG pathways and white squares indicate predicted drugs.
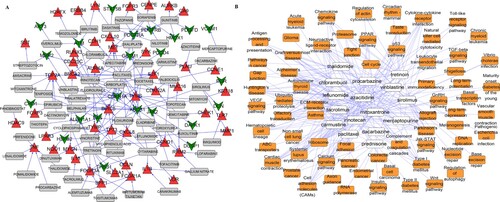
Figure 5. Survival analysis of key genes in OC using Kaplan – Meier analysis. (A) CCND1, (B) CCNE1, (C) CXCL10, (D) ERBB4, (E) LPAR3, (F) SST, (G) ERBB4, and (H) LPAR3. Patients were split into high and low expression groups based on the median expression of genes.
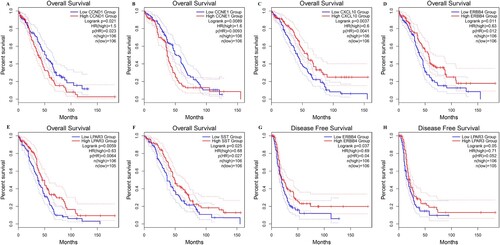
Figure 6. Protein expression of key genes verified using the Human Protein Atlas (HPA) database. (A) AURKB, (B) CENPE, (C) DCN, (D) LYN, (E) PDGFRA, and (F) PDGFRB.
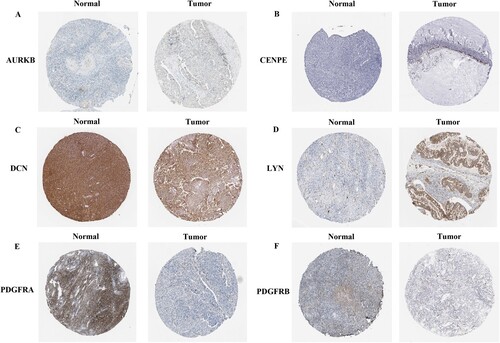
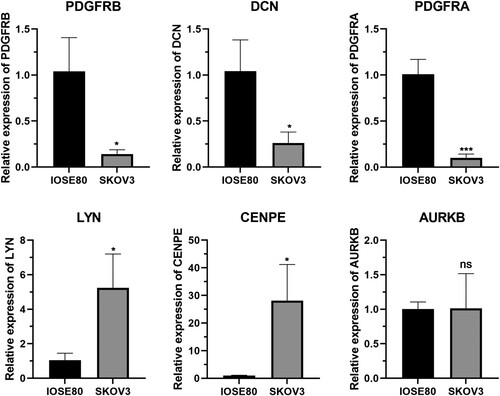
Figure 7. Validation of key genes using quantitative reverse transcription polymerase chain reaction (qRT-PCR). Data are presented as mean ± standard deviation. Statistical significance was determined using two-tailed t-test; * P < 0.05; *** P < 0.001.
Supplemental Table
Download MS Word (21.9 KB)Supplemental Figures
Download Zip (6.5 MB)Data availability statement
The data were derived from the following resources available in the public domain: the UCSC Xena database (https://xena.ucsc.edu/), GENCODE database (https://www.gencodegenes.org/), and DISEASES (https://diseases.jensenlab.org/Search). The qRT-PCR data in this study are available in 4TU. ResearchData under DOI: https://doi.org/10.4121/22267030 at https://doi.org/10.4121/22267030.