
Figures & data
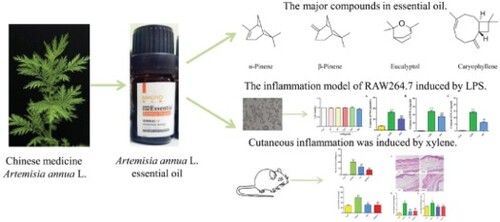
Figure 1. Chemical identification of AO by GC-MS. A. Total ion chromatograms of the AO. B. The mass spectrogram of every component. C. Chemical structures of major compounds identified in AO. AO: Artemisia annua L. essential oil; (1): α-Pinene; (2): Camphene; (3): β-Pinene; (4): β- Myrcene; (5): β-Cymene; (6): Eucalyptol; (7): γ-Terpinene; (8): (-)-trans-Pinocarveol; (9): Camphor; (10): Terpine-4-ol; (11): Caryophyllene; (12): Germacrene D; (13): Caryophyllene oxide.
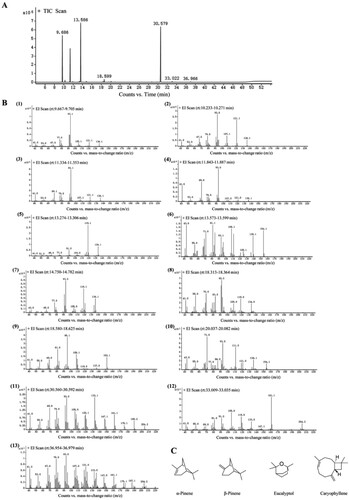
Table 1. Chemical composition of AO identified by GC-MS.
Figure 2. Cell viability of RAW264.7 exposes to different concentration of AO for 24 h. Data represent the mean ± SD (n = 3). Con: Control; AO: Artemisia annua L. essential oil.
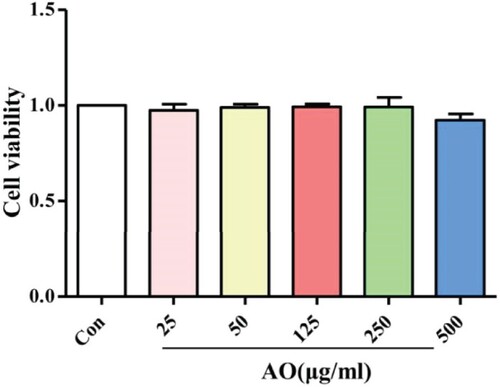
Figure 3. Effect of AO on NO, TNF-α and IL-6 production in RAW 264.7 cells. Data represent the mean ± SD (n = 3).***p < 0.001 vs Con, ## p < 0.01 vs LPS,### p < 0.001 vs LPS. Con: Control; AO: Artemisia annua L. essential oil.
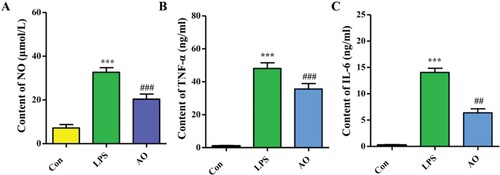
Figure 4. Effect of AO on degree of ear swelling in mice induced by xylene. Data represent the mean ± SD (n = 5).***p < 0.001 vs Con, ### p < 0.001 vs xylene. Con: Control; AO: Artemisia annua L. essential oil; positive: DSZBC.
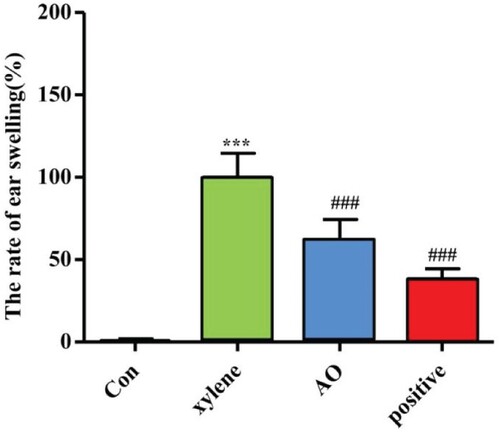
Figure 5. Effect of AO on histopathological morphology. A. Representative HE staining; B and C. Statistical quantification of number of macrophages and epidermal thickness. Data represent the mean ± SD (n = 5). ***p < 0.001 vs Con, ### p < 0.001 vs xylene. Con: Control; AO: Artemisia annua L. essential oil; positive: DSZBC.
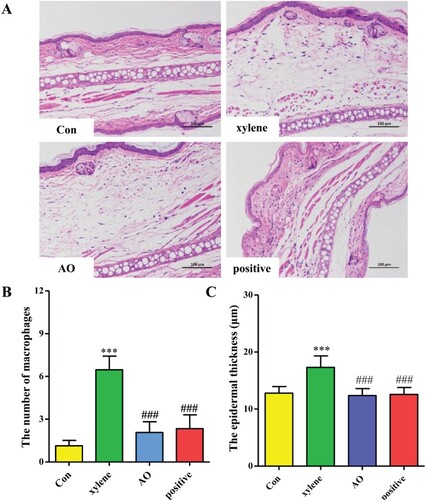
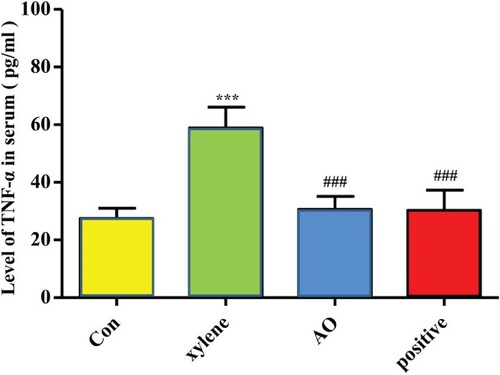
Figure 6. Effect of AO on the level of TNF-α in serum. Data represent the mean ± SD (n = 5). ***p < 0.001 vs Con, ### p < 0.001 vs xylene. Con: Control; AO: Artemisia annua L. essential oil; positive: DSZBC.
Data availability statement
The data that support the findings of this study are openly available in Mendeley Data at http://doi.org/10.17632/k6j6c2gnkh.1.