
Figures & data
Figure 1 The entire experimental process. Experimental design for the quantitative proteomic analysis, the experiment is divided into three groups (control group, insomnia model group, and the warm acupuncture treated insomnia group). Protein extraction, trypsin digestion, and labeled with iTRAQ regents. The labeled peptides were separated by SCX chromatography and fractions were analyzed by reversed-phase LC-MS/MS, all data were analyzed by bioinformatics tools from different aspects (GO, KEGG).
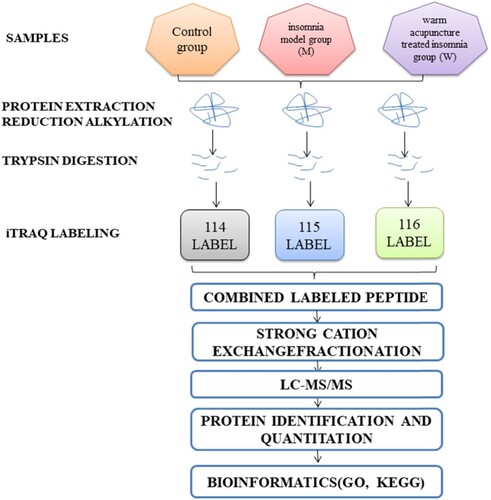
Table 1 Quantitative expression analysis of proteins.
Figure 2 Cluster analysis of differential level proteins between M vs. C. (Colors indicate the differential protein levels, which increase successively from green to red. Increased levels of proteins are indicated in red, and decreased levels are marked in green)
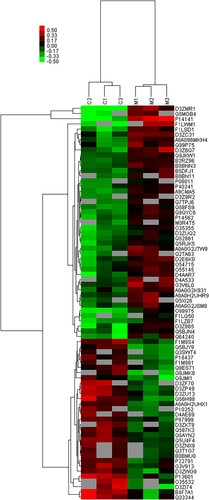
Figure 3 Cluster analysis of differential level proteins between W vs. C. (Colors indicate the differential protein levels, which increase successively from green to red. Increased levels of proteins are indicated in red, and decreased levels are marked in green)
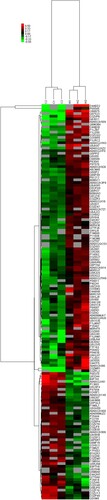
Figure 4 Cluster analysis of differential level proteins between W vs. M. (Colors indicate the differential protein levels, which increase successively from green to red. Increased levels of proteins are indicated in red, and decreased levels are marked in green)
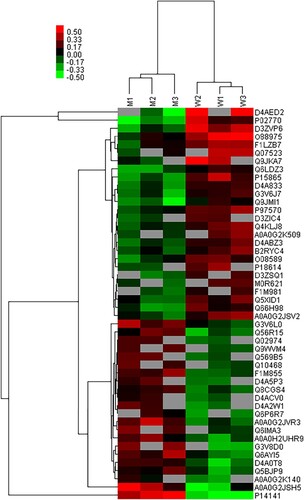
Figure 5 GO analyses of protein functions in M vs. C. The GO functional annotations of 76 differentially expressed proteins in M vs. C. The 76 differentially expressed proteins were classified from three aspects: biological processes, molecular functions, and cellular components.
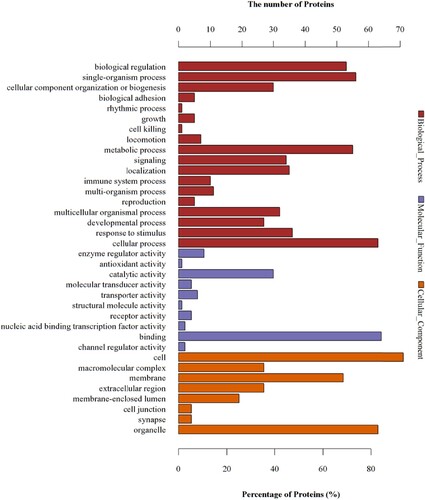
Figure 6 GO analyses of protein functions in W vs. C. The GO functional annotations of 149 differentially expressed proteins in W vs. C. The 149 differentially expressed proteins were classified from three aspects: biological processes, molecular functions, and cellular components.
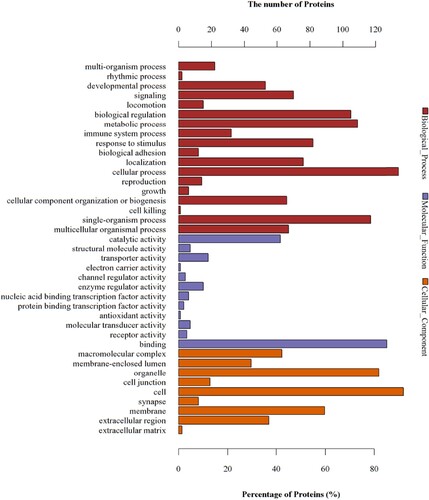
Figure 7 GO analyses of protein functions in W vs. M. The GO functional annotations of 48 differentially expressed proteins in W vs. M. The 48 differentially expressed proteins were classified from three aspects: biological processes, molecular functions, and cellular components.
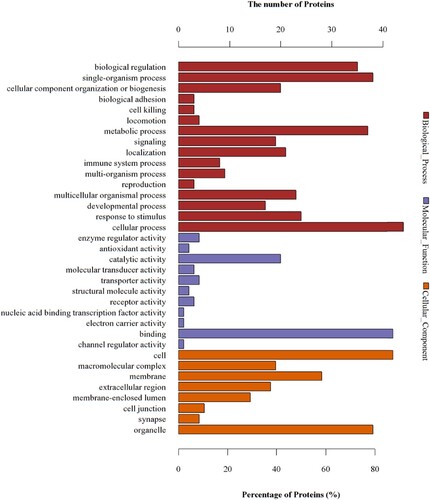
Figure 8 KEGG analyses of protein functions in M vs. C. KEGG database pathway annotation was performed on 76 differentially expressed proteins in the insomnia model group with the control group.
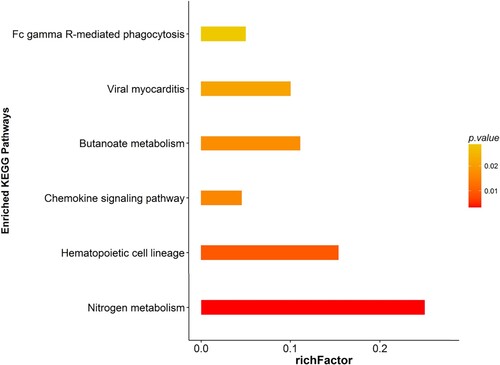
Figure 9 KEGG analyses of protein functions in W vs. C. KEGG database pathway annotation was performed on 149 differentially expressed proteins in the warm acupuncture-treated insomnia group with the control group.
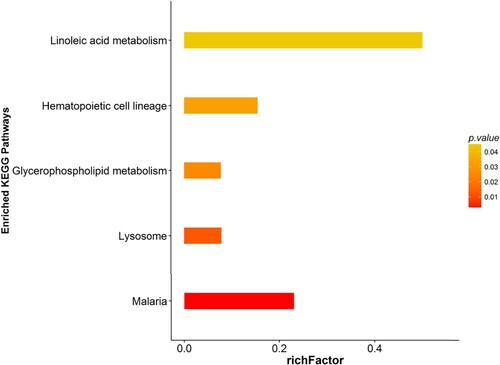
Figure 10 KEGG analyses of protein functions in W vs. M. KEGG database pathway annotation was performed on 48 differentially expressed proteins in the warm acupuncture-treated insomnia group with the insomnia model group.
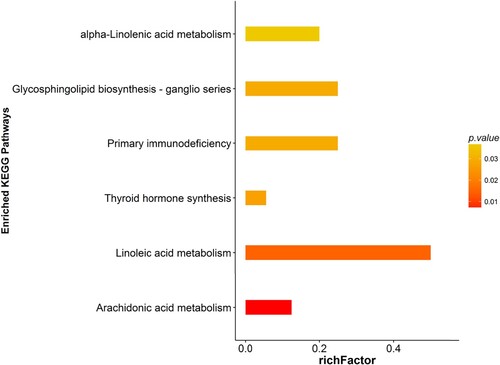
Table 2 Differentially expressed proteins between W/M vs. M/C groups.
Table 3 Differentially expressed proteins between W/M vs. W/C groups.
Supplemental Figures
Download MS Word (146.6 KB)Data availability statement
The data that support the findings of this study are openly available in ‘Zenodo’ at https://doi.org/10.5281/zenodo.8268067
Ethics approval and consent to participate
The animal experiments were approved by the Institutional Animal Care and Use Committee of Inner Mongolia Medical University (YKD2018096).