
Figures & data
Table 1. AST/ALT ratio in relation to clinical and laboratory features in MDS patients.
Figure 1. Gene mutation distribution and survival analysis. (A) Common genes carrying mutations in MDS patients. (B) Overall survival of 265 patients with primary MDS stratified by AST/ALT ratio ≤1.19 vs AST/ALT ratio >1.19 (P = 0.013). (C) Leukemia-free survival of 265 patients with primary MDS stratified by AST/ALT ratio ≤1.19 vs AST/ALT ratio >1.19 (P = 0.044).
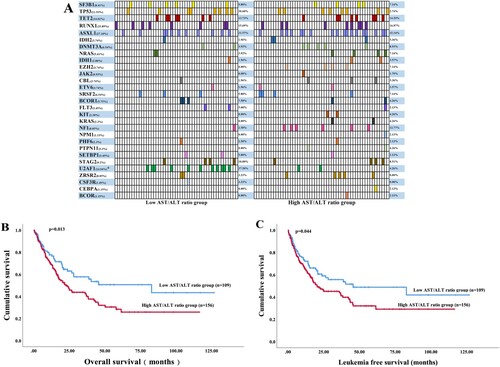
Table 2. Multivariate analyses involving IPSS-R for overall survival and leukemia-free survival in primary MDS patients.
Table 3. Multivariate analyses involving IPSS-M for overall survival and leukemia-free survival in primary MDS patients.
Data availability statement
The data that support the findings of this study are available at https://doi.org/10.17632/ntvnbvnznm.2.