
Figures & data
Figure 1. Identified differential mRNA and lncRNA. A,B. Principal component analysis (PCA) of mRNA and lncRNA expression profiles. C,D. Volcano plot of DE mRNA and lncRNA. In the volcano plot, the X axis indicates the fold change, which is shown on a log2 scale, and the Y axis indicates the P value, which is shown on a −log10 scale. Red represents mRNA up-regulation and blue represents mRNA down-regulation. For mRNA, | log2FC |>1 was selected, P < 0.05; for lncRNA, | log2FC |>0.5 and P < 0.05 were selected, which were considered statistically different. E,F. RT-PCR to verify the top five lncRNAs with the most significant up-regulation and down-regulation trends. G. Heat map of DE mRNA and lncRNA. In the heat map, red indicates lncRNAs or mRNAs that were up-regulated, and blue indicates lncRNAs or mRNAs that were down-regulated.
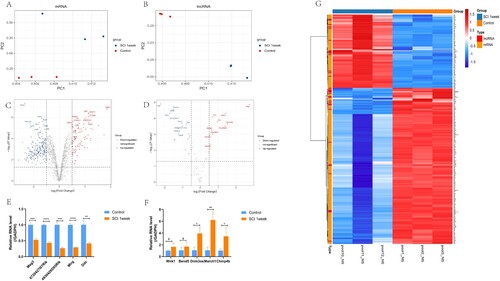
Table 1. The top 10 up-regulated and down-regulated lncRNAs.
Figure 2. Functional enrichment analysis of differential mRNA after SCI. A,B. GO enrichment analysis and KEGG pathway enrichment analysis were performed for up-regulated mRNA. C,D. GO enrichment analysis and KEGG pathway enrichment analysis were performed for down-regulated mRNA. E. GSEA analysis of all mRNA expression profiles after SCI revealed the biological process. F. GSEA analysis of all mRNA expression profiles for KEGG pathway after SCI.
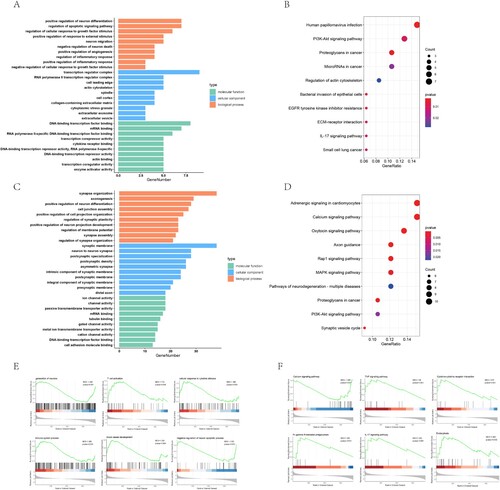
Figure 3. Construction of PPI network and GSEA analysis of hub gene and module gene function. A. Protein-protein interaction networks of DE mRNAs. Nodes indicate mRNAs. Lines represent the interactions between DE mRNAs. Changes in DE mRNA expression level were indicated by color changes, with red indicating up-regulation and blue indicating down-regulation. The 15 hub genes obtained by Degree algorithm in Cytohubba plug-in are represented by yellow border. B. Cluster calculation through Mcode plug-in, and the first four core sub-networks with scores greater than 4 are obtained. Top left: Cluster1, Score 7.7; Top right: Cluster2, Score 4.25; Bottom left: Cluster3, Score 4; Bottom right: Cluster4, Score 4. C. Biological processes involving hub genes in GSEA analysis. D. The biological processes involved in GSEA analysis of mRNA in corresponding Cluster.
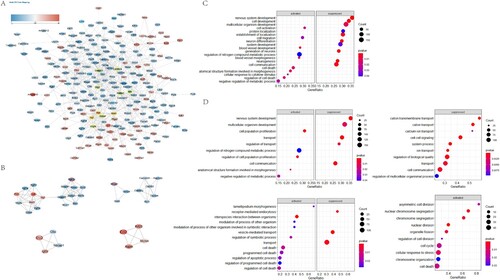
Table 2. The hub genes and their corresponding degrees.
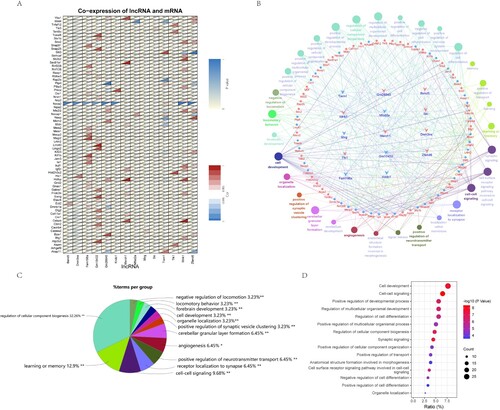
Figure 4. Construction and functional analysis of lncRNA and mRNA co-expression network. A. Pearson correlation coefficient and P value of lncRNA and mRNA were calculated to obtain the correlation between co-expressed lncRNA and mRNA. Displayed by correlation heat map. B. The lncRNA-mRNA co-expression network was established by Cluego, and the biological process and pathway of mRNA were analyzed. C. The proportion of genes enriched by each biological process pathway is displayed by pie chart. D. The first 15 GO enrichment items obtained from the biological process pathway analysis of mRNA in the co-expression network were displayed.
Supplemental Material
Download Zip (213.1 KB)Data availability statement
The data supporting the findings of this study are available in the figshare repository at https://doi.org/10.6084/m9.figshare.20065661.v3.