
Figures & data
Figure 1. Effects of GE on food intake (A) and body weight (B). Data are presented as mean ± S.D. (n = 8 per group). *p < 0.05 shows comparison with the control group, and #p < 0.05 shows comparison with the cEFS group.
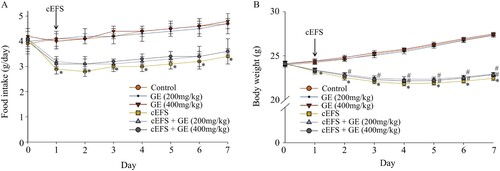
Figure 2. Effects of GE on the EPM test. Effects of GE on time spent in open arms (A). Effects of GE on the number of entries in the open arms (B). Data are presented as mean ± S.D. (n = 8 per group). *p < 0.05 shows comparison with the control group, and #p < 0.05 shows comparison with the cEFS group.
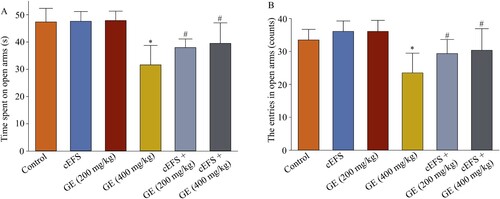
Figure 3. Effect of GE on the distance traveled in OFT. Data are presented as mean ± S.D. (n = 8 per group). *p < 0.05 shows comparison with the control group, and #p < 0.05 shows comparison with the cEFS group.
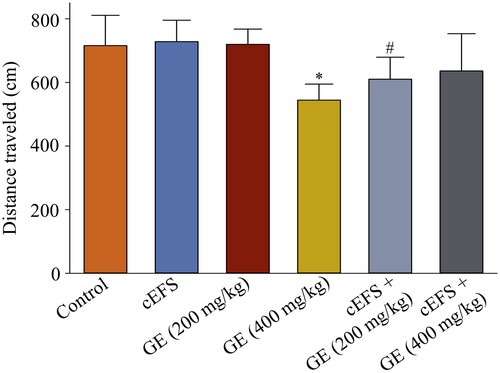
Figure 4. Effects of GE on the dopamine and serotonin levels in the brain. Effects of GE on dopamine (A) and serotonin (B) levels in the brain. Data are presented as mean ± S.D. (n = 8 mice per group). *p < 0.05 shows comparison with the control group, and #p < 0.05 shows comparison with the cEFS group.
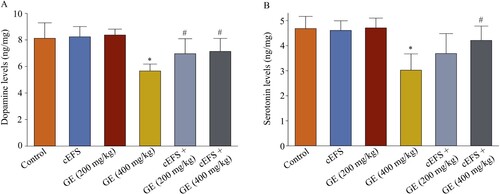
Figure 5. Effects of GE on the serum CORT level. Data are presented as mean ± S.D. (n = 8 mice per group). *p < 0.05 shows comparison with the control group, and #p < 0.05 shows comparison with the cEFS group.
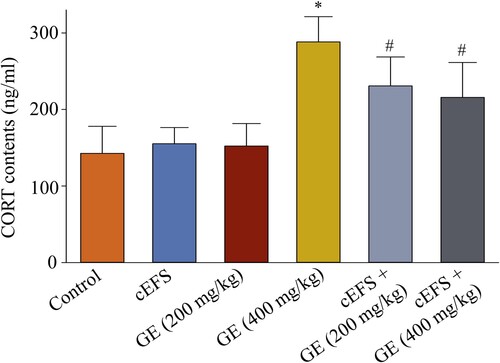
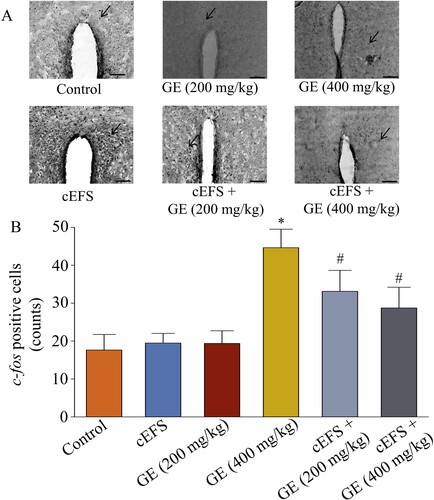
Figure 6. Effects of GE on c-fos expression in the PVN region of brain. Immunohistochemical image of c-fos positive cells in the PVN region (20x). The arrow shows the c-fos positive cells (A). Statistical comparison of the number of c-fos positive cells in the PVN brain region in different groups (B). Data are presented as mean ± S.D. (n = 8 mice per group). *p < 0.05 shows comparison with the control group, and #p < 0.05 shows comparison with the cEFS group.
Data availability statement
The data that support the findings of this study are openly available in figshare https://doi.org/10.6084/m9.figshare.24219004.v5.