
Figures & data
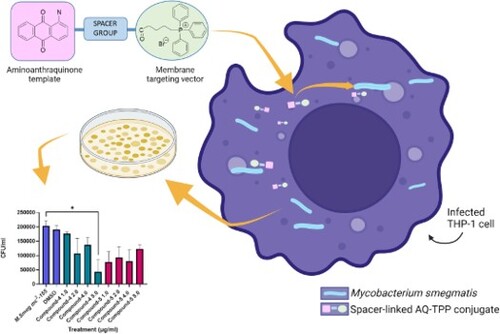
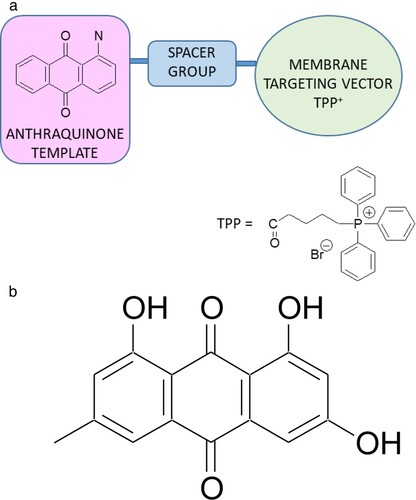
Figure 1. (a) Bacteria-Targeting Concept: Spacer-linked Anthraquinone-TPP (AQ-TPP) Conjugates. (b) Anthraquinone natural product: emodin.
Scheme 1. Reagents and conditions: (a) 4-amino-1-butanol, DMSO, 95°C; (b) 1,3-di-4-piperidylpropane, DMSO, 95°C; (c) TFA, diethyl ether; (d) (4-carboxybutyl)triphenylphosphonium bromide, DCC, DMAP, CH2Cl2; (e) 4-(carboxybutyl)triphenylphosphonium bromide, PyBOP, HOBt, DIPEA, DMF.
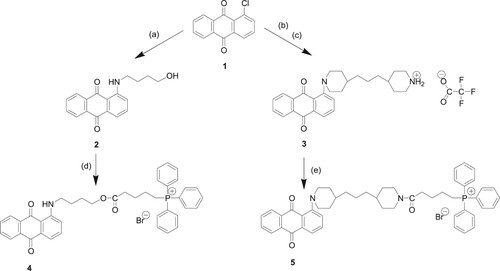
Table 1. Minimum inhibitory and bactericidal concentrations of compounds (4) and (5) screened against M. smeg mc2155 and MRSA (NCTC 13616)*.
Figure 2. Confocal microscopy live cell imaging of HCT-116 colon cells, treated with 2 μM of compound (4) for 2 h. Panel (i) (A) Compound (4) stained with LysoTrackerTM Green DND26 (60 nM), (B) LysoTrackerTM Green DND26 (60 nM), and (C) merged image showing no colocalization. Panel (ii) (A) Compound (4) stained with MitoTrackerTM Green FM (50 nM), (B) MitoTrackerTM Green FM (50 nM), and (C) merged image showing clear colocalization. Areas where compound (4) and mitochondria colocalize appear as yellow/orange (C). Captured at 63 × magnification, scale bar 10 μm.
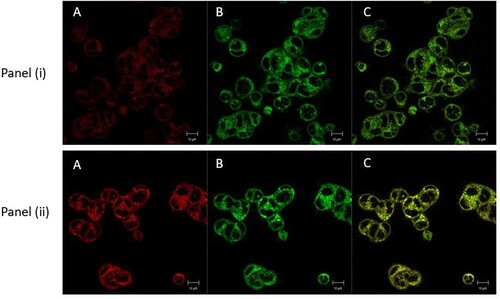
Figure 3. Cytotoxic effect of different MOIs of M. smeg mc2155 infection on differentiated THP-1 cells over 24 h, determined by the MTT assay. Results are mean ± SD of three independent determinations. NTC = no treatment control, 0.1% Triton-X-100 was the positive control. Statistical Analysis was performed using Graph Pad Prism 9.3.1. One-way ANOVA using Dunnett’s multiple comparison test, where **p < 0.01.
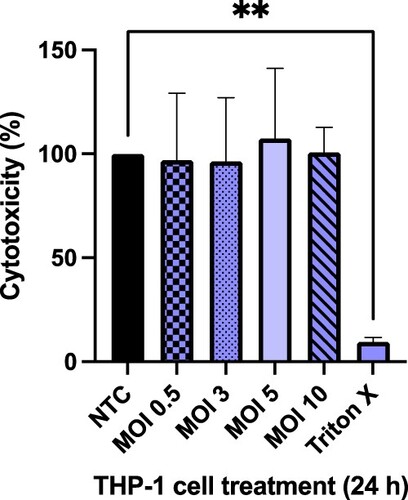
Figure 4. Colony counts on Mueller Hinton agar plates following treatment of intracellular infections. THP-1 cells were infected with M. smeg mc2155 for 4 h at an MOI of 1:5, then washed and treated for 24 h. Colony counts were measured following the growth of M. smeg mc2155 on solid agar after incubation for 72 h. Results are mean ± SD of three independent determinations. Statistical Analysis was performed using Graph Pad Prism 9.3.1. One-way ANOVA using Dunnett’s multiple comparison test, where *p < 0.05.
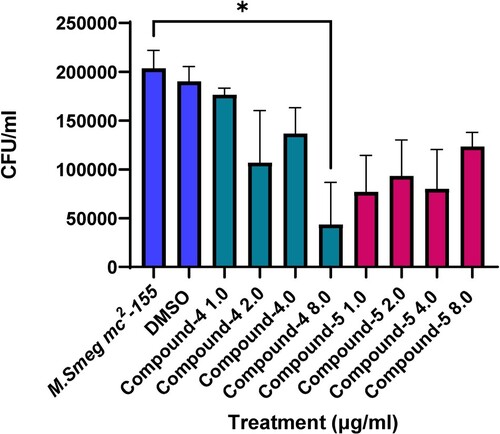
Figure 5. Colony counts on Mueller Hinton agar plates following treatment of intracellular infections. THP-1 cells were infected with M. smeg mc2155 for 4 h at an MOI of 1:5, then washed and treated for 24 h. Colony counts were measured following the growth of M. smeg mc2155 on solid agar after incubation for 72 h. In vitro intracellular LC50 determination for compound (4) was calculated to be 3.8 µg/mL.
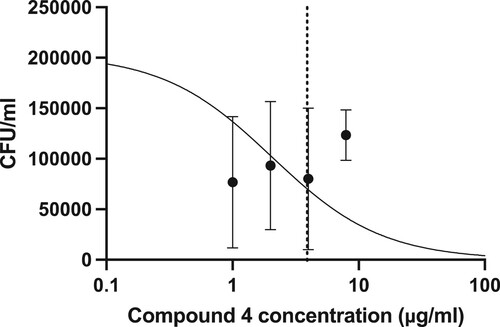
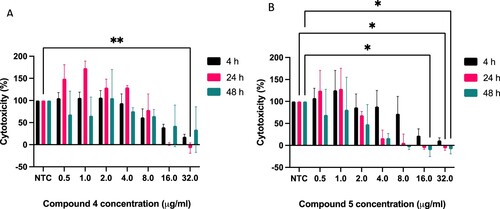
Figure 6. Cytotoxic effect of Compounds 4 (A) & 5 (B) on differentiated THP-1 cells over 4, 24 and 48 h. Results are mean ± SD of three independent determinations (each repeat done in triplicate), NTC = no treatment control. Statistical Analysis was performed using Graph Pad Prism 9.3.1. Two-way ANOVA using Tukey’s multiple comparison test, where *p < 0.05 and **p < 0.01
Supplemental Figures
Download MS Word (1.6 MB)Data availability statement
The authors confirm that the data supporting the findings of this study are available within the article [and/or] its supplementary materials. Raw data has been shared to https://figshare.com/ at https://doi.org/10.6084/m9.figshare.25335139
.