
Figures & data
Figure 1. Flow chart outlining the process for selecting participants.
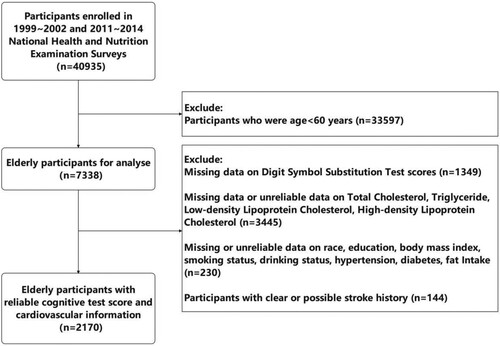
Table 1. General characteristics of all participants.
Table 2. Serum lipids profile and Digit Symbol Substitution Test score: multivariate linear regression analysis.
Table 3. Female serum lipids profile and Digit Symbol Substitution Test scores: multivariate linear regression analysis adjusting for numbers of conceptions and live births.
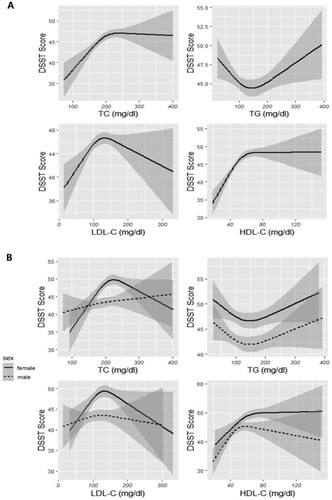
Figure 2. The nonlinear association between serum lipids and DSST scores through GAM natural cubic spline fitting. The gray area around the curve represents the 95% confidence interval. Group A showed the nonlinear association between serum lipids and DSST scores in the total population. Group B showed the nonlinear association between serum lipids and DSST scores in sex-stratified analyses. The degrees of freedom of the RCS curve are set to 3. Abbreviations: TC, total cholesterol; TG, triglyceride; LDL-C, low-density lipoprotein cholesterol; HDL-C, high-density lipoprotein cholesterol; DSST, digit symbol substitution test.
Data availability
The NHANES raw data is available at https://wwwn.cdc.gov/nchs/nhanes/default.aspx.
Data that support the findings of this study are available in the Zenodo repository as ‘NHANES DATASET05162024’ at http://doi.org/10.5281/zenodo.11199721
.