Figures & data
Fig. 1 Recursive partitioning example used to predict whether a person will play tennis or not depending on the temperature and humidity. Integers in squares indicate the order of the partitioning. Blue areas represent predictions of “Yes,” yellow areas represent predictions of “No.”
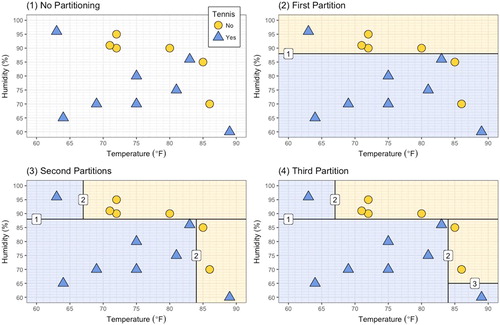
Fig. 2 Corresponding prediction rules for recursive partitioning depicted in .
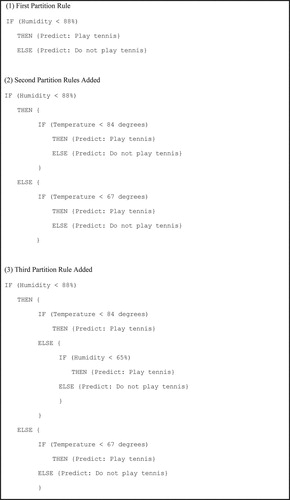
Fig. 3 The decision tree indicates a set of partitioning rules (algorithm) for predicting whether a person will play tennis or not depending on the temperature and humidity. The terminal nodes of “Play” and “Do not play” are predictions made by the model.
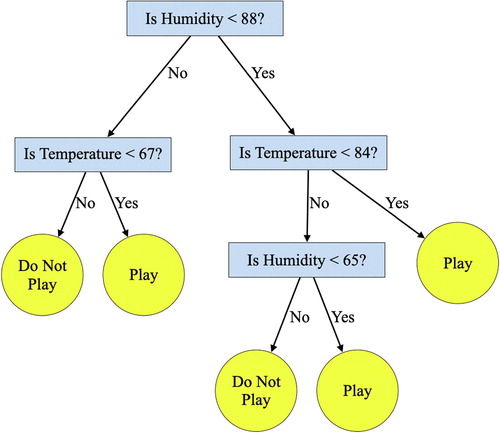
Fig. 4 The decision tree after pruning using a 10% inclusion threshold.
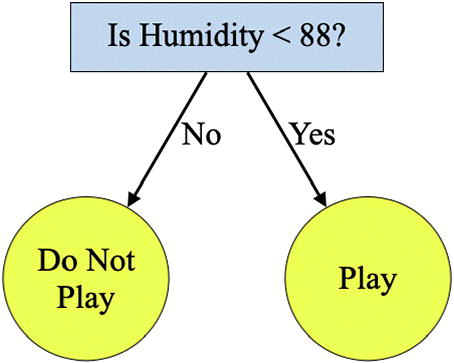
Table 1 Model building and evaluation process for classification tree and logistic regression using the tennis example.
Fig. 5 Timeline showing the chronology of the PD activities and individual assignments.
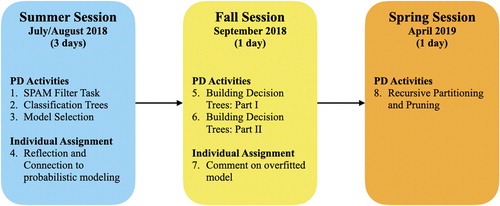
Fig. 6 Partitioning of the dot plot (Panel 1) corresponding to the 10-rule overfitted model (Panel 2) created by one pair of teachers.
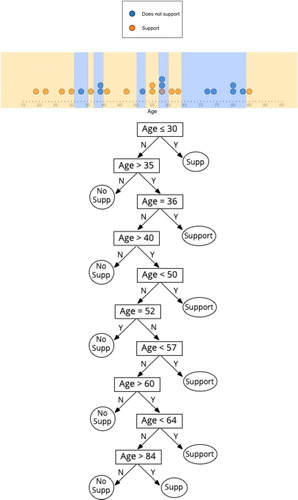
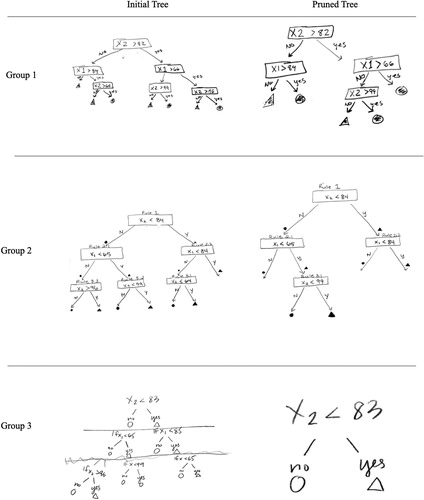
Fig. 7 Initial tree diagrams (first column) and pruned tree diagrams (second column) produced by each group or teachers during the second part of the spring professional development session.