Figures & data
Fig. 1 Temporality-driven directed acyclic graphs (DAGs) drawn to demonstrate the three principal roles that covariates can play when situated: before the specified exposure (potential confounders); between the specified exposure and outcome (likely mediators); and after the specified outcome (consequences of the outcome). The upper DAG (A) includes: all possible unmeasured covariate sets; all probabilistic causal paths (between preceding and subsequent variables); and two of the many other covariate roles (mediator outcome confounders [MOCs] and competing exposures) that are possible when one or more relevant causal paths are missing. The lower DAG (B) is the simplified example provided to medical undergraduates in the present study which excluded unmeasured covariates and MOCs.
![Fig. 1 Temporality-driven directed acyclic graphs (DAGs) drawn to demonstrate the three principal roles that covariates can play when situated: before the specified exposure (potential confounders); between the specified exposure and outcome (likely mediators); and after the specified outcome (consequences of the outcome). The upper DAG (A) includes: all possible unmeasured covariate sets; all probabilistic causal paths (between preceding and subsequent variables); and two of the many other covariate roles (mediator outcome confounders [MOCs] and competing exposures) that are possible when one or more relevant causal paths are missing. The lower DAG (B) is the simplified example provided to medical undergraduates in the present study which excluded unmeasured covariates and MOCs.](/cms/asset/8b77d09c-d2b2-466d-9f62-cdb7ec5644cc/ujse_a_1936311_f0001_c.jpg)
Fig. 2 Flowchart summarizing the numbers of participants in the present study who completed each successive task within the directed learning exercise (white boxes; black text); and those participants who failed to complete one or more of these tasks (grey boxes; white text).
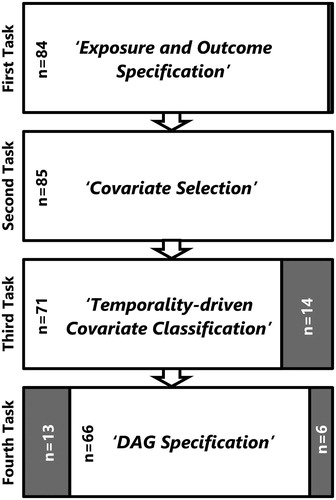
Table 1 Clinical specialties, modifiable health service exposures, and guideline-related outcomes selected by 85 third year medical undergraduates receiving instruction in the use of DAGs to inform analytical modeling for causal inference. Students were also invited to speculate what additional covariates might act as likely causes of their selected outcome (in addition to their specified exposure), and these have been classified under four headings: patient characteristics and practitioner characteristics; healthcare facilities; and service catchment area.
Table 2 A comparison of student-reported and assessor-validated covariate classifications generated during the third task within the directed learning exercise (“Temporality-driven Covariate Classification”) among students who completed this task (n = 71/85, 83.5%).
Table 3 A comparison of student-reported and assessor-validated covariate classifications generated during the fourth task within the directed learning exercise (“DAG Specification”) among students who completed this task (n = 66/85, 77.6%).
Table 4 A comparison of student-reported covariate classifications generated during the third task (“Temporality-driven Covariate Classification”) with those classified in the fourth task (“DAG Specification”) among students who completed both tasks (n = 58/85, 68.2%).