Figures & data
Table 1 Summary statistics.
Fig. 1 Scatterplot displaying the relationship between the Amazon price and the number of pieces.
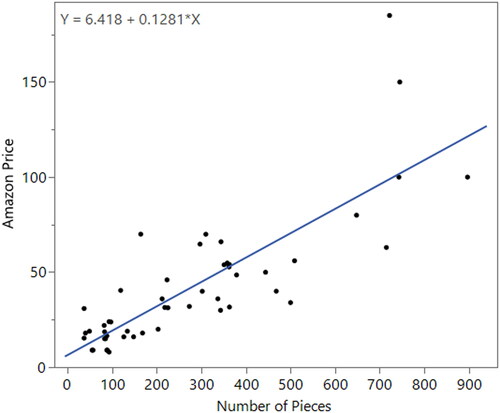
Fig. 2 Scatterplot displaying the relationship between the Amazon price and the number of pieces for LEGO City and LEGO Friends sets.
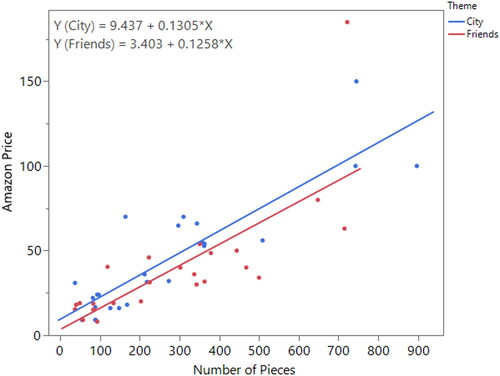
Fig. 3 Multiple linear regressions prediction expression output for additive model.
Fig. 4 Scatterplot displaying the relationship between the Amazon price and the number of pieces for small and large brick sets.
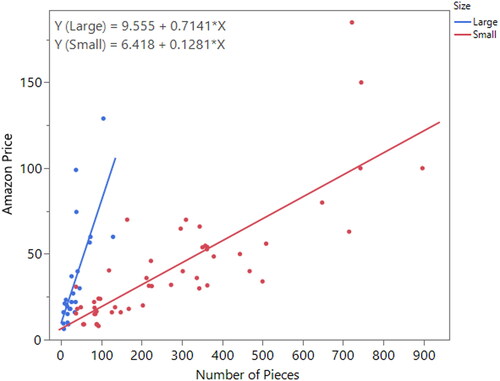
Fig. 5 Multiple linear regressions prediction expression output for model with interaction.
Table 2 Example responses from a virtual implementation of the activity.
Supplemental material