Figures & data
Fig. 1 Listed Age for the 184 women in Slack (Citation1997).
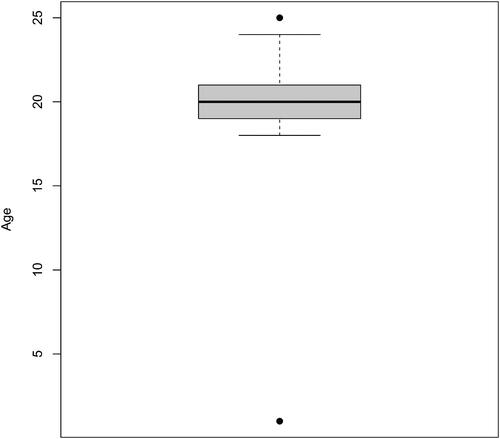
Table 1 Errors/Likely errors in the dataset.
Fig. 2 Fat versus Age, Height, Hips, and Weight. The observation with Age equal to one is omitted from the upper left-hand scatterplot.
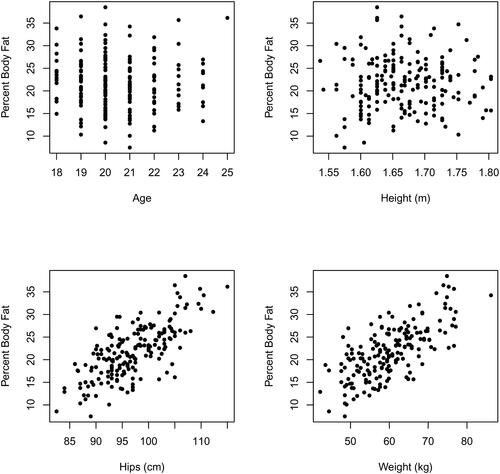
Fig. 3 Weight versus Hips.
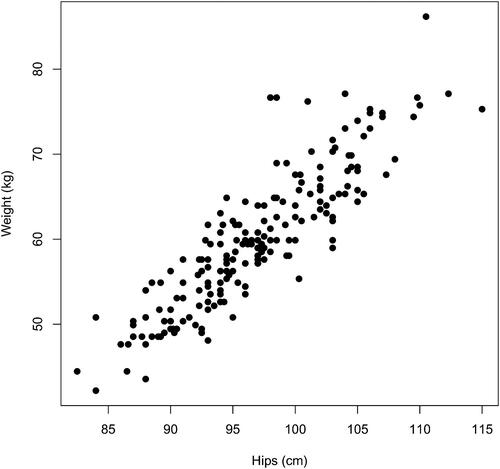
Table 2 Variable correlations (rounded) with Fat.
Table 3 Best subsets, according to adjusted for a fixed number of predictor variables. The highest adjusted
occurs when using 9 predictor variables.
Fig. 4 Best subsets adjusted versus the number of predictor variables.
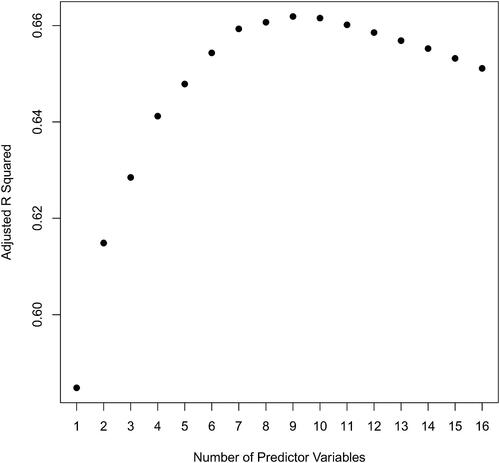
Table 4 Forward selection.
Table 5 Backward elimination.
Table 6 Fitting percent body fat to BMI, Hips, Waist, and Ankle.
Supplemental material