Figures & data
Fig. 1 The Measures of Association app showing an example of a Prerequisites section.
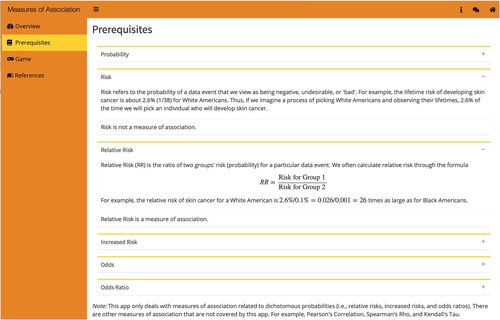
Fig. 2 Examples of simulation-based exploration modules showing the Law of Large Numbers, Confidence Intervals for Proportions, and Time Series Decompositions apps.
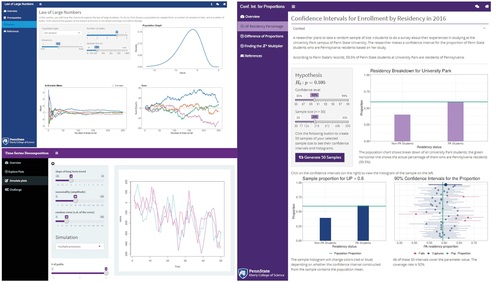
Fig. 3 Examples of game-based quizzing styles in the Shiny app collection showing Variable Types, Correlation Guessing, Measures of Association, and Hypothesis Testing apps.
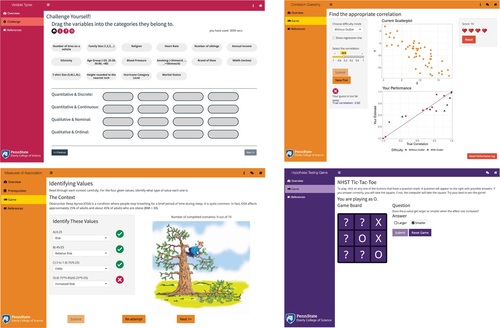
Fig. 4 The proportion of correct answers to multiple choice assessment questions for sections using an app (in black) and sections not using an app (in red). Lines indicate 95% confidence intervals based on the logistic model.
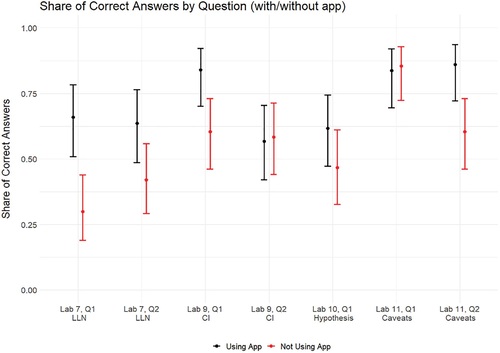
Table 1 Confidence Intervals and p-values for increased odds of correct responses with use of Shiny apps.