Figures & data
Fig. 1 Data Science Process Workflow for Data Detectives Program adapted from workflow from Grolemund and Wickham (Citation2016).
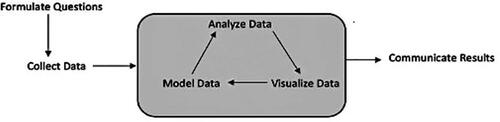
Table 1 Data science practices for data detectives program adapted from Jiang and Kahn (Citation2019).
Fig. 2 An example of the whole group Google trend activity discussion comparing pizza and tacos over a 7-day period.
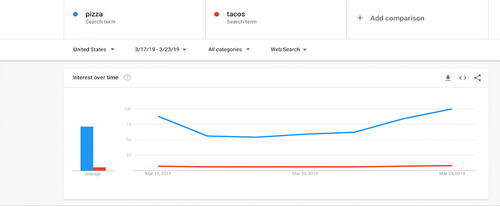
Fig. 3 An example of a participant’s Google trend activity comparing four fast-food restaurants.
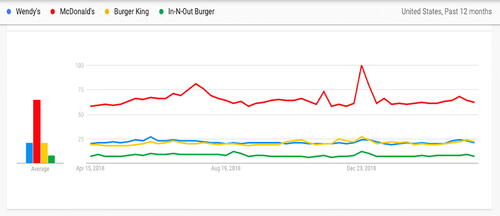
Fig. 4 Snack Data activity example of scatterplot and bar chart created with participants inputted data shared in spreadsheet.
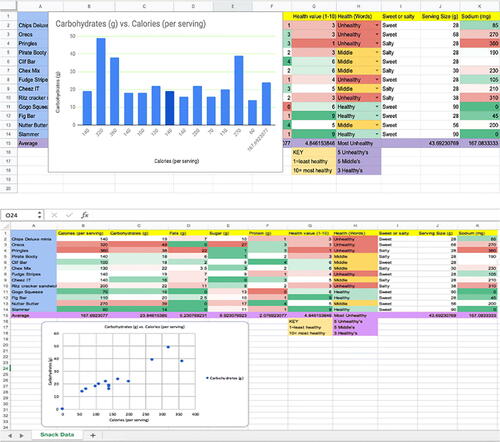
Fig. 5 Example of prebuilt code in the R Jupyter notebooks for the Introduction to R lesson.
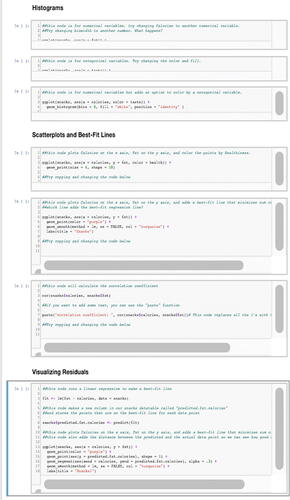
Fig. 6 Example of prebuilt code in the R Jupyter notebooks for the Pixar and Dreamworks lesson.
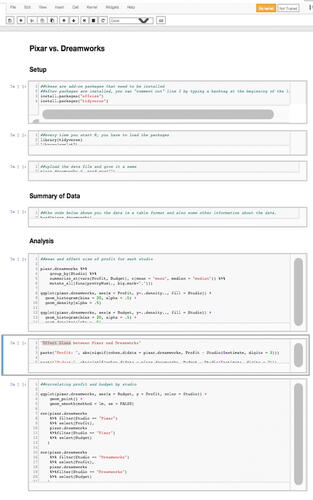
Table 2 Coding system used to evaluate participants work and reflective responses.
Fig. 7 Percentages of participants that engaged in data science practices and process in the Pixar and Dreamworks Activity.
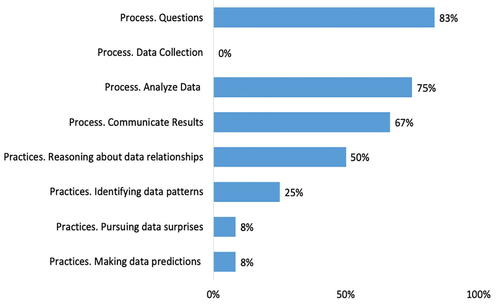
Fig. 8 Percentages of participants that engaged in data science practices and process in their Final Project.
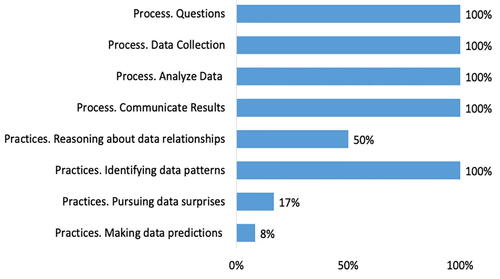
Fig. 9 Example of one Participant’s Final Project Scatterplot.
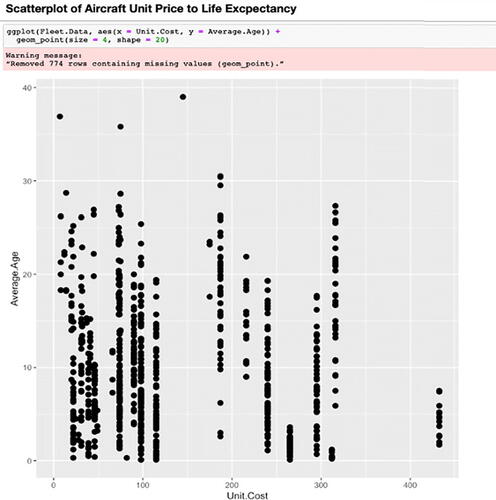
Fig. 10 Percentages of Participants that had a basic understanding of the statistics content covered.
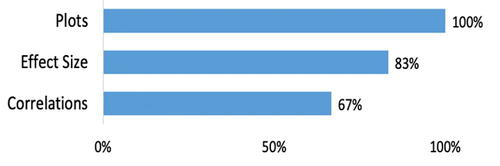
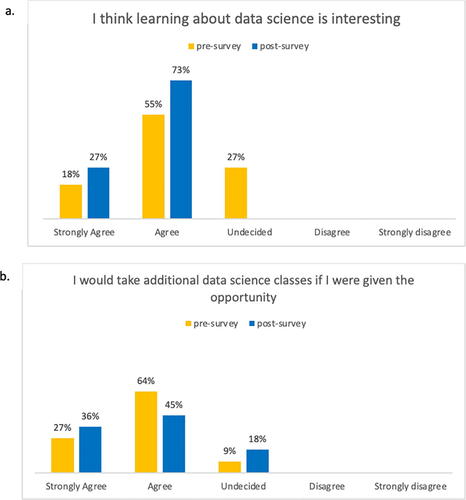
Fig. 11 Pre- and post-surveys of participants attitudes toward data science.