Figures & data
Table 1 Descriptive statistics for responses to eleven end of semester survey items.
Table 2 Themes present in 18 responses for the survey item asking: What three things from the class were the most beneficial?
Table 3 Themes present in 18 responses for the survey item asking: What three things from the class were the least beneficial?
Table 4 Themes present in 18 responses for the survey item asking: Overall do you think it was useful for you to take the statistics practicum course? Please explain your response.
Table 5 Themes present in 18 responses for the survey item asking: Based on what you know now, do you think you would have rather completed this senior statistics consulting project with an outside organization as the client or with an internal client from within the university? Please explain your response.
Table 6 Categories for difficulties or challenges faced in the practicum project from students in both 2018 and 2021.
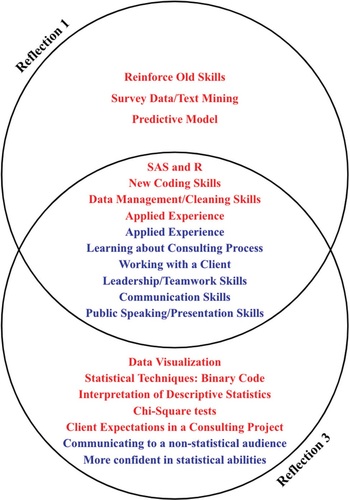
Fig. 1 Statistical and nonstatistical knowledge that students expected to gain (Reflection 1) and thought they gained (Reflection 3) from the project. Items are responses to questions regarding expected or gained knowledge; red font indicates statistical knowledge and blue font indicates nonstatistical knowledge.