Figures & data
Fig. 1 Student gender by gender of statistician in drawing.
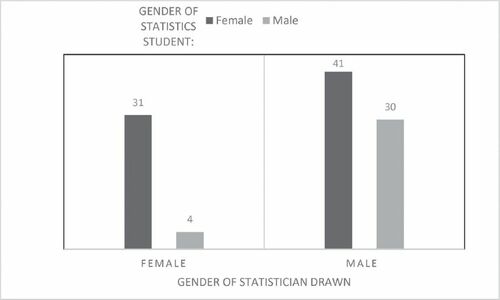
Fig. 2 Student race by race of statistician in the drawing.
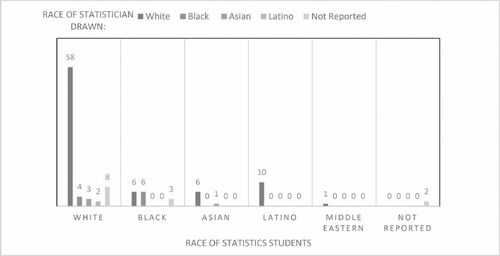
Fig. 3 Student gender by gender of mathematician in drawing.
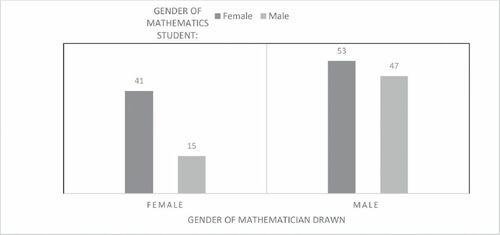
Fig. 4 Student race by race of mathematician in the drawing.
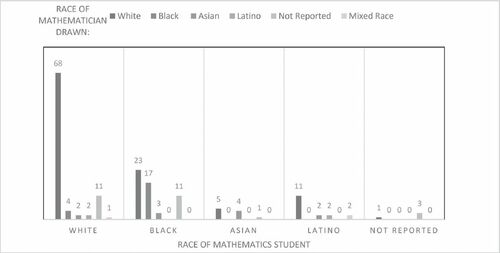
Table 1 Keywords by theme for each class.
Table 2 A 2 × 2 contingency table for calculating the coefficient.
Fig. 5 Statistics class clustering fit indices.
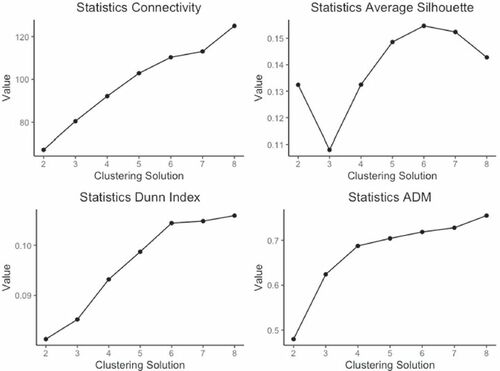
Fig. 6 Mathematics class clustering fit indices.
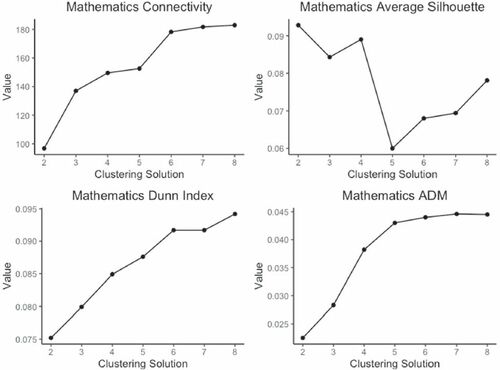
Table 3 Statistics Class Clustering Fit Indices.
Table 4 Mathematics Class Clustering Fit Indices.
Fig. 7 Dendrogram for statistics class.
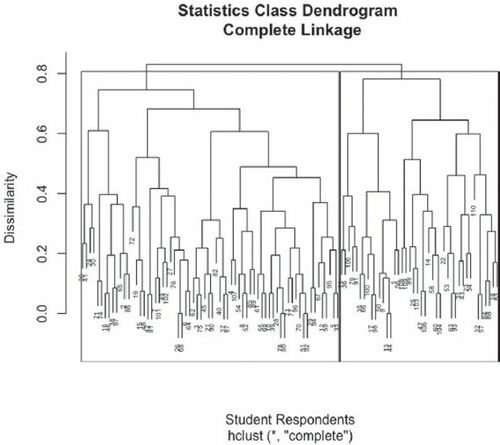
Table 5 Statistics class cluster variable proportions.
Fig. 8 Dendrogram for mathematics class.
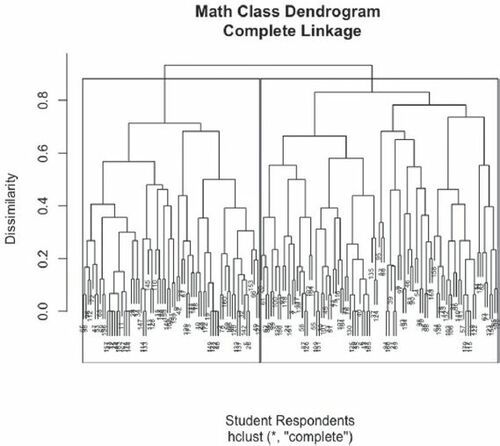
Table 6 Mathematics class cluster variable proportions.