Figures & data
Table 1 Initial questions, with answer choices, on correlation and causation.
Table 2 Revised and new questions, with answer choices, about correlation and causation.
Fig. 1 (study-time, original version) To estimate the average number of daily hours that students study at a large public college, a researcher randomly samples some students, then calculates the average number of daily study hours for the sample. Pictured (in scrambled order) are three histograms: One of them represents the population distribution of number of hours studied; the other two are sampling distributions of the average number of hours studied , one for sample size n = 5, and one for sample size n = 50. Circle the most likely distribution for each description.
●Population distribution: A B C
●Sampling distribution for n = 5: A B C
●Sampling distribution for n = 50: A B C
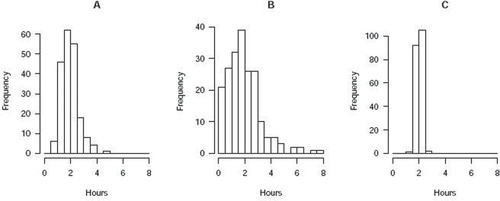
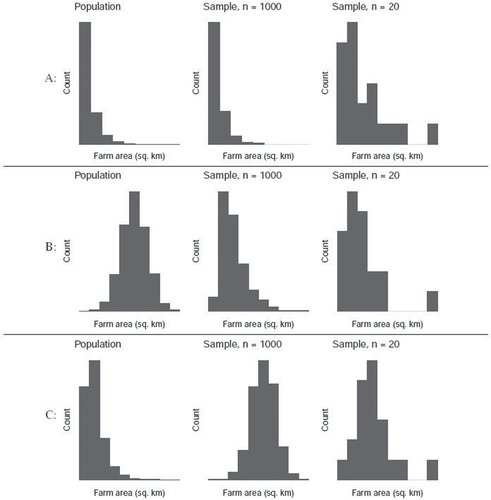
Fig. 2 (farm-areas) Farmer Brown collects data on the land area of farms in the United States (in square kilometers). By surveying her farming friends, she collects the area of every farm in the United States, and she makes a histogram of the population distribution of U.S. farm areas. She then takes two random samples from the population, of sizes and n = 20, and plots histograms of the values in each sample. One of the rows below shows her three histograms. Using the shape of the histograms, choose the correct row.