Figures & data
Fig. 1 An example to illustrate the impact of correlation on the variances of sums and differences. The pairs of heights from fathers and sons have a larger variance for their sums and a smaller variance for their differences than those from unrelated pairs.
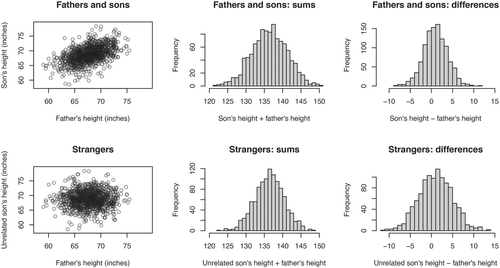
Fig. 2 A visual representation of the definition for sample covariance. Each data point (xi
, yi
) has a corresponding shaded rectangle whose area is the deviation from the variables’ means, . Larger rectangles correspond to data points further from their means. Rectangles are shaded green when the variables “move together” (i.e., both values are larger or smaller than their respective means) and shaded red when they do not (e.g., one value is larger than its mean and the other is smaller). The sample covariance is the difference between the total area of the green rectangles and the red rectangles (divided by n – 1).
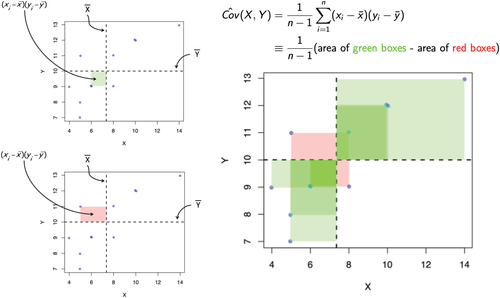
Fig. 3 A summary of how underestimating or overestimating the variance of the effect estimate due to ignoring correlated outcomes can lead to anti-conservative or conservative inference, respectively.
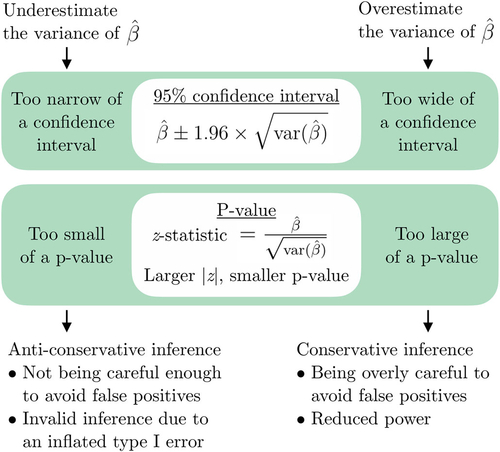
Fig. 4 Example results, corresponding to the results for the deep-fried food predictor under the null hypothesis when using an analysis approach that ignores correlation, for one of the eight settings that students investigate. The plots summarize the results from the analyses of the 1000 studies run for this setting. The left plot is a histogram of the 1000 point estimates (’s), the middle plot shows 50 of the 1000 confidence intervals where the blue line indicates the truth, and the left plot shows a histogram of the 1000 p-values obtained.
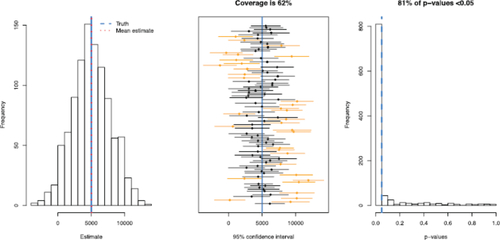
Fig. 5 Results table for the activity with the solutions that students complete shown in red.
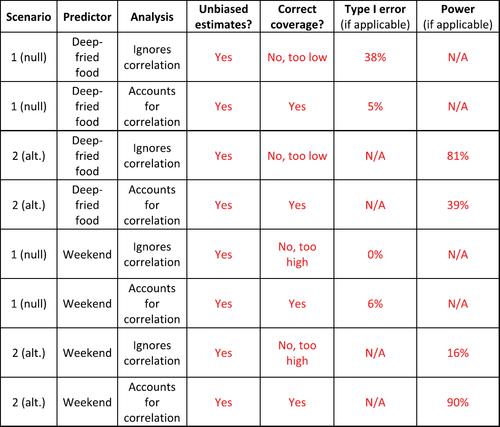
Fig. 6 Example dataset for a single replicate in “long” form with a single observation per row and the observations from a single cluster spanning multiple rows.
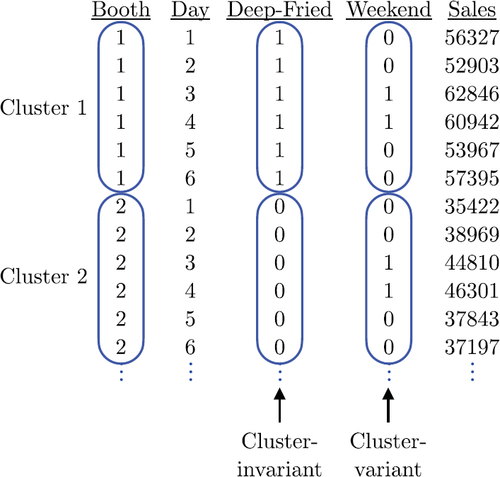
Fig. 7 A flowchart summarizing the implications of ignoring correlation between outcomes for predictors that vary or do not vary within cluster. For intuition about the second connection, have students recall the example about the variability of the sums and differences of father–son heights. For more detail about the third connection, see .
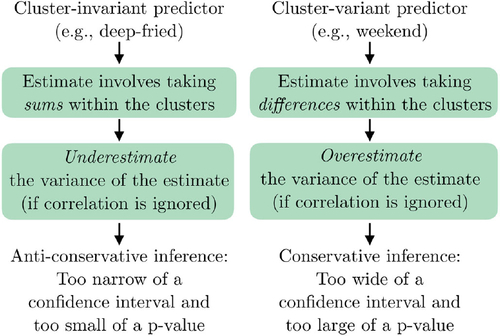
Table 1 Comparison of the point estimates and standard errors (SEs) obtained for a correlated dataset using Gaussian generalized estimating equations (GEE) models with different working correlations and a naive linear regression model that assumes independent outcomes.
Table 2 Example questions and answers used in homework assignments, quizzes, and tests throughout the semester to reinforce students’ intuition about the impact of ignoring correlation between outcomes.