Figures & data
Fig. 1 Distributions of bryozoan mass and metabolic rate by species and stage, in the original (uncorrected) data.
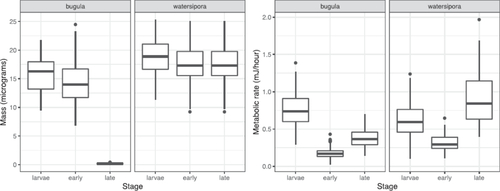
Fig. 2 Relationship between mass and metabolic rate for marine bryozoans by species and stage, in the corrected data.

Fig. 3 Distribution of metabolic rate for each run in the study, by species and stage.
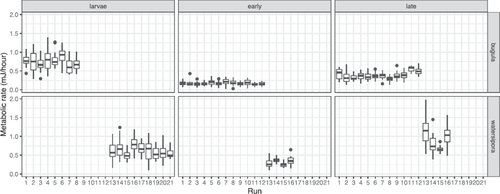
Fig. 4 Residual and normal QQ plots for linear regression of metabolic rate on mass in the early-stage Bugula.
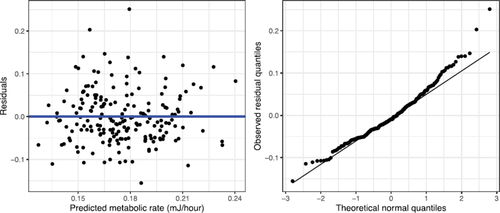
Fig. 5 Possible relationship shapes between mass and metabolism, using the model in (2).
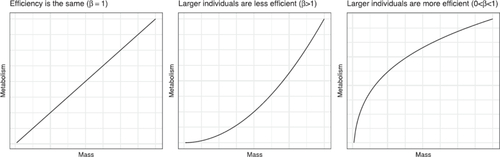
Fig. 6 Relationship between log mass and log metabolic rate for larval and early-stage bryozoans.
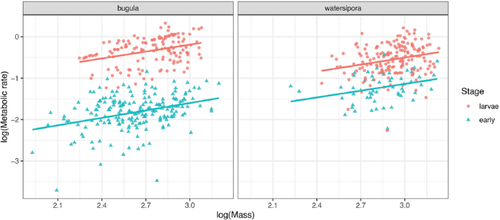
Fig. 7 Diagnostic plots for the fitted model (8). The middle plot shows a normal quantile-quantile plot for the residuals , while the plot on the right is a normal quantile-quantile plot for the estimated random effects
for each run i.
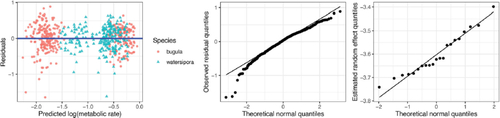
Table 1 Estimated coefficients for fixed effects in (9).
Supplemental Material
Download Zip (1.1 MB)