Figures & data
Table 1 Summary of the elements of the statistical investigative cycle (Bargagliotti et al. Citation2020).
Fig. 1 Summarize and describe distribution cluster from the sixth-grade CCSSM.
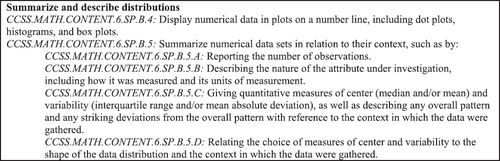
Table 2 Example of coding of CCSSM LEs based on the GAISE II Framework.
Table 3 Analytic Approaches to investigating the OTL relative to the highlights of the GAISE II report.
Fig. 2 Boxplots of the total number of K-8 LEs by state for all states (n = 52) and for states that are not CCSSM verbatim ().
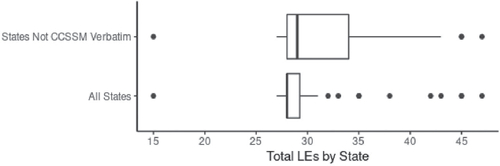
Table 4 Comparison of Kentucky Grade 3 LEs and comparative CCSSM Grade 3 LEs.
Table 5 Descriptive statistics for the number of LEs in each state by grade level for all states (n = 52) and for states that are not CCSSM verbatim (n = 31) in parentheses when different.
Table 6 A descriptive summary of the common LEs for grades K-5 with counts of the numbers of states that have the same wording (same), similar wording, or did not have the LE (absent).
Table 7 A descriptive summary of the common LEs for grades 6–8 with counts of the numbers of states that have the same wording (same), similar wording, or did not have the LE (absent).
Fig. 3 Venn Diagram of the total number of LEs for each possible connection between the four elements of the statistical investigative process. Note the areas are not proportional to the counts.
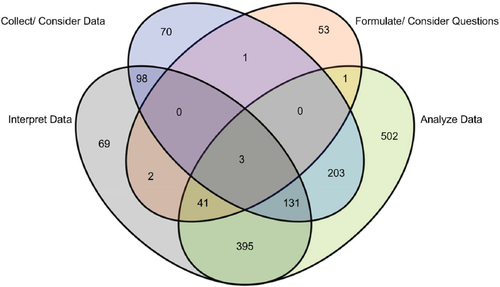
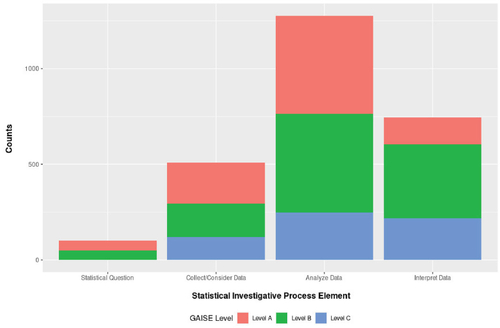
Fig. 4 Stacked bar graph of total LEs for each statistical investigative process element by GAISE developmental level ().