Figures & data
Fig. 1 Unstructured data points from a dataset of lake caught fish.
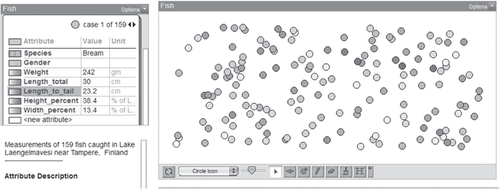
Fig. 2 Dataset comparing ski resorts in the Northeast region.
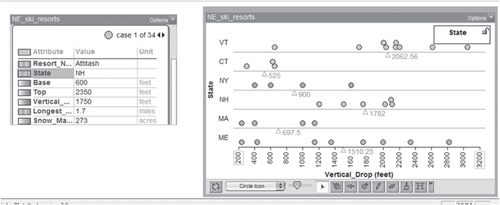
Fig. 3 Dynamic visual representation of a comparison between two samples collected from the same population.
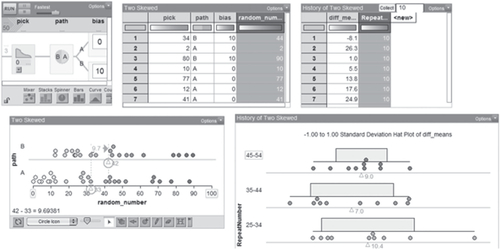
Table 1 Summary of Control versus Intervention group performance on conceptual assessment items.
Supplemental material