Figures & data
Fig. 1 Central limit theorem activity plots. Plot 1 shows the distribution of the outcomes of a die roll. Plot 2 displays the means of five die rolls observed during the activity and Plot 3 shows the observed means of 10 rolls.
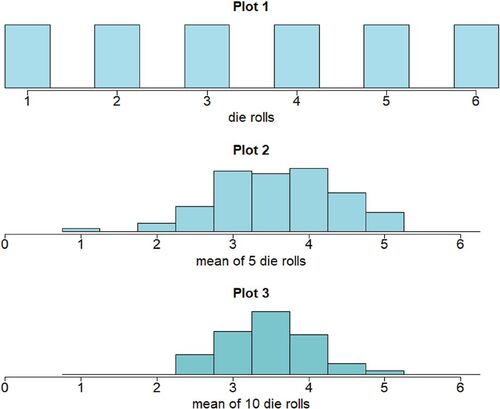
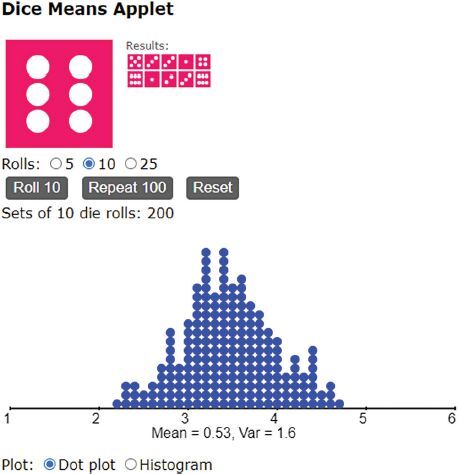
Fig. 2 An applet that facilitates simulation of the Central Limit Theorem die roll activity.