Figures & data
Fig. 1 The simplest DAG with two nodes and one edge.
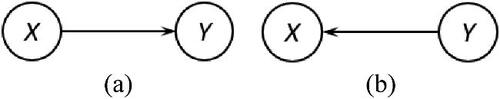
Fig. 2 Two DAGs with three nodes.
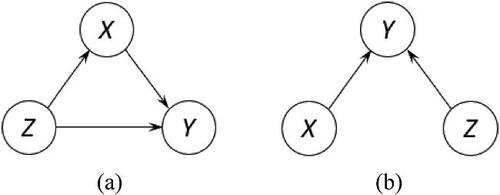
Fig. 3 The DAG with one intervention node.
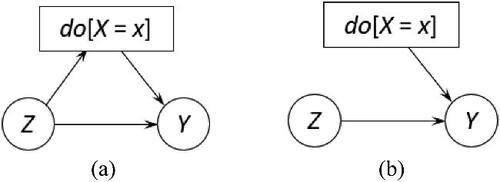
Fig. 4 The DAG of Example 1.

Fig. 5 Example 1 built in Netica.
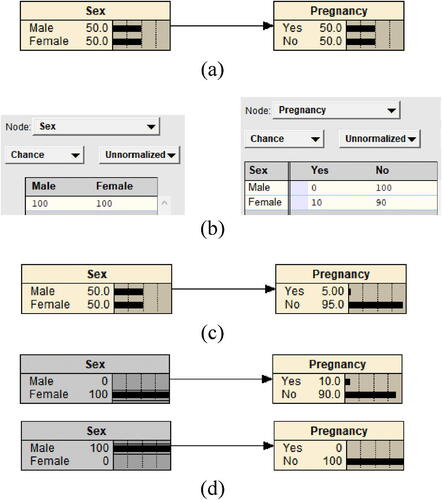
Table 1 The contingency table of Sex and Pregnancy.
Table 2 The contingency table of Culture and Color.
Fig. 6 The DAG of Example 2.

Fig. 7 Example 2 built in Netica.
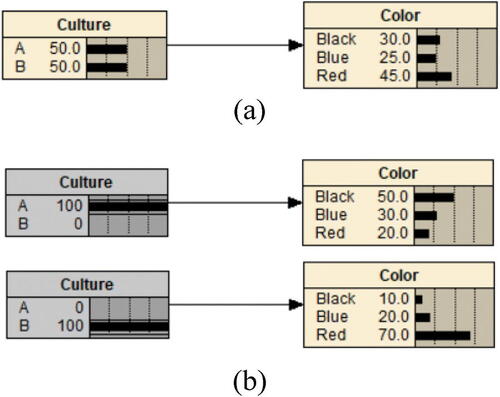
Table 3 Results of a clinical trial of medication treatment.
Fig. 8 The DAG of Example 3.
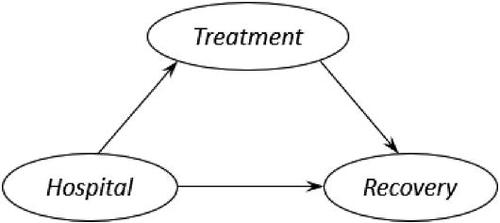
Fig. 9 Example 3 built in Netica.
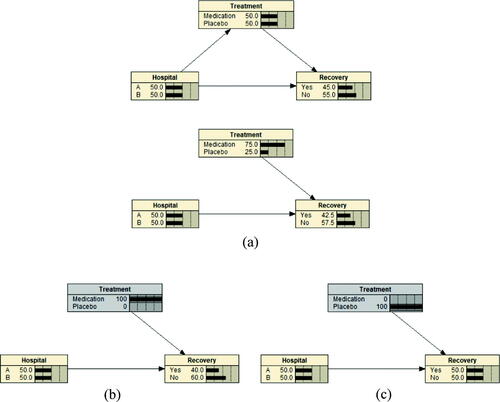
Table 4 The probability tables of Jen and Car.
Fig. 10 The DAG of Example 4.
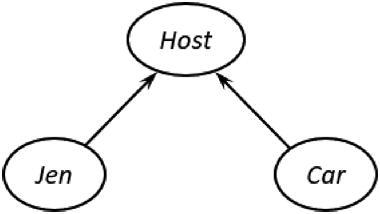
Fig. 11 Example 4 built in Netrica.
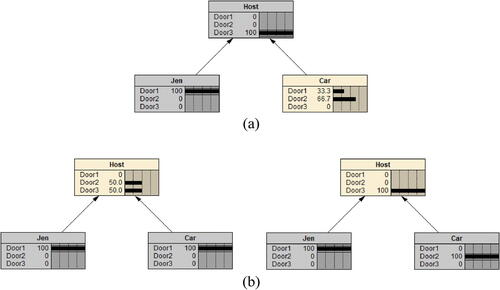
Table 5 The joint probability table of Jen, Car, and Host.
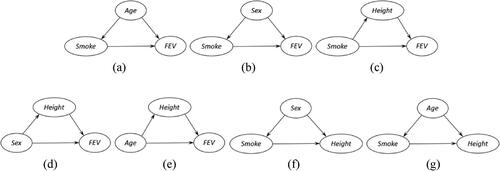
Fig. 12 The DAG of Example 5.
Adapted from “Causal Inference in Introductory Statistics Courses,” by Cummiskey et al. Citation2020, Journal of Statistics Education, 28, p. 6 under the terms of the Creative Commons CC BY license.
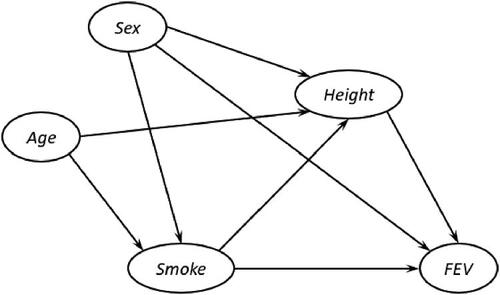
Fig. 13 Example 5 built in Netica and intervention on Smoke only.
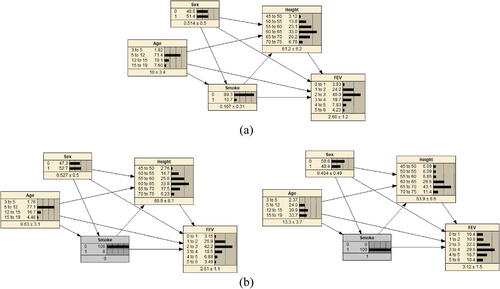
Fig. 14 The spurious relationship between Smoke and FEV in Example 5.
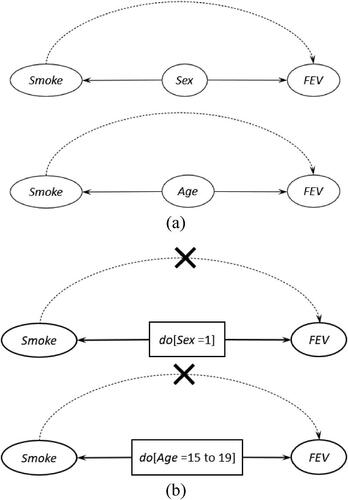
Fig. 15 Example 5 built in Netica and intervention on Smoke, Age, and Sex.
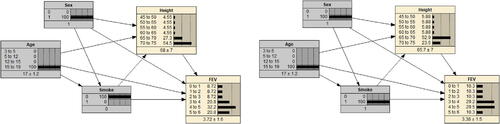
Fig. 16 The causal relationship between Smoke and FEV through Height in Example 5.
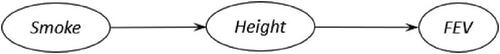
Fig. 17 The triangular substructures of the DAG of Example 5.