Figures & data
Fig. 1 FIRES data: Histogram (the left panel) and LLESF plot (the right panel).
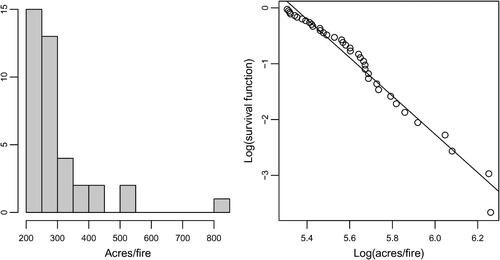
Fig. 2 CITIES data: Histogram (the left panel) and LLSEF plot (the right panel).
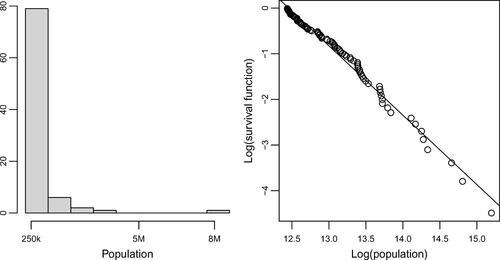
Table 1 The empirical and the estimated 95th and 99th percentiles connected with the FIRES and CITIES data.
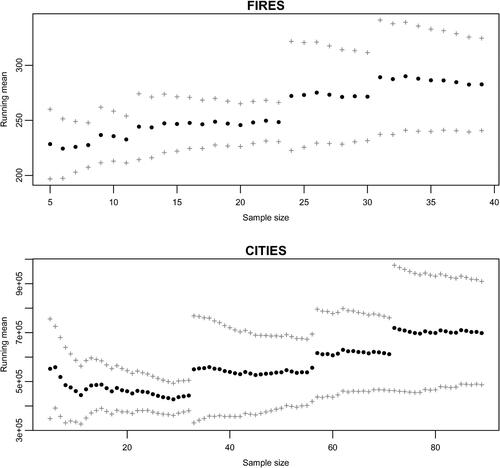
Fig. 3 Running mean plots.
Supplemental material