Figures & data
Figure 1. Wild and Pfannkuch's Investigative Cycle (Citation1999, page 226)
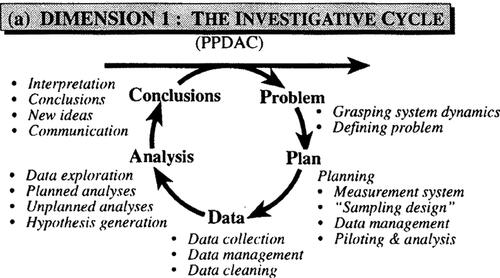
Figure 2. A condensed example of the guided note outlines used in the course.
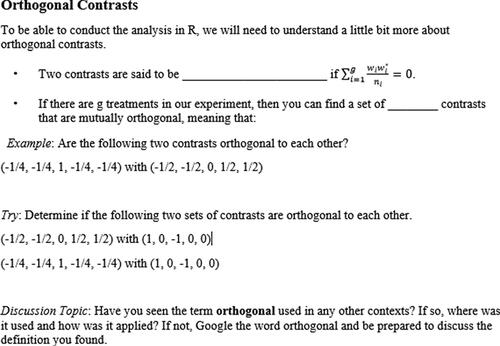
Figure 3. An example of using Google Sheets to aid in data collection
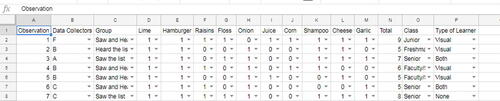
Figure 4. Diagram of the nested experimental design for the artist experiment
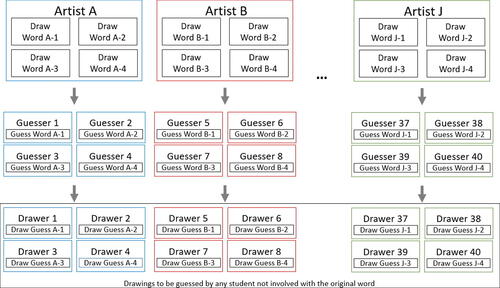
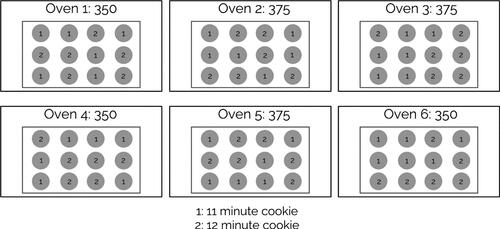
Figure 5. Diagram of a potential Split Plot design for the cookie experiment
Data Sharing
Data sharing is not applicable to this article as no new data were created or analyzed in this study.