Figures & data
Table 1 Paired sample t-test statistics comparing well-being and ill-being measures before and after treatment.
Fig. 1 Pre-test distributions of well-being and ill-being measures.
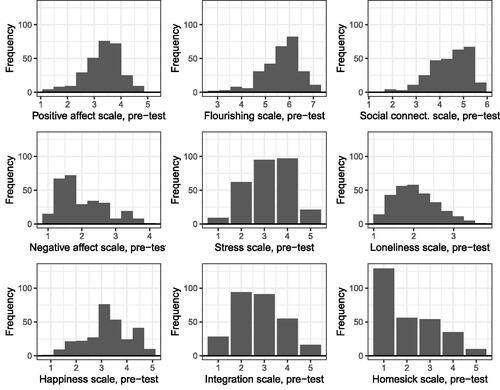
Fig. 2 Relationships between several well-being and ill-being measures. A small amount of jitter has been added to the points to see the relationships more clearly.
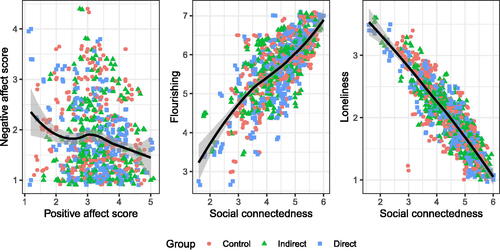
Fig. 3 Differences between post-test and pre-test scores for several well-being and ill-being measures.
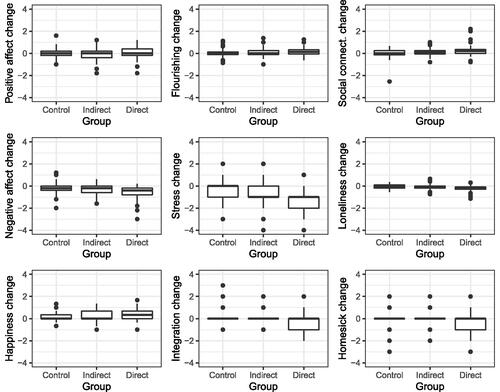
Table 2 ANOVA contrast results comparing changes in well-being and ill-being measures across treatment groups.
Supplemental material
supplementary_material.zip
Download Zip (643.6 KB)midterm.pdf
Download PDF (158 KB)data_dictionary.pdf
Download PDF (161.7 KB)class_activity.pdf
Download PDF (167.4 KB)Data Availability Statement
The data discussed in this article are available at https://github.com/ciaran-evans/dog-data-analysis, along with code for all the analyses described in the article.