Figures & data
Table 1 QDA training program comparison
Table 2. Development of the CQDATP framework in three phases.
Table 3. Topics, prerequisites, and learning objectives of the training modules.
Table 4. Composition of participants. The symbol * indicates participants in Phase 2 (5 out of the 10 juniors and 13 out of the 17 seniors) who had also participated in Phase 1, amounting to a total of 18 out of 38 participants from Phase 1.
Table 5. Benchmarks for Module Excel and Module R
Table 6. Comparison of selected exit quiz questions between Phase 1, 2 and Phase 3.
Figure 1. Examples of step-by-step instructions in the training module R
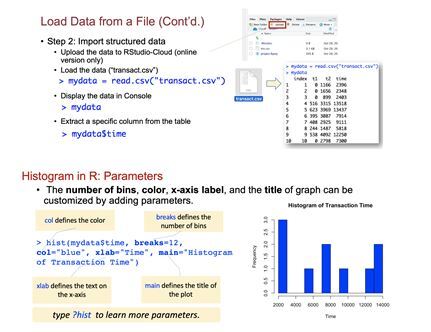
Figure 2. Assessment result of Module Excel in Phase 1. The benchmarks are described in . The benchmarks were assessed before (Pre, in green) and after (Post, in blue) the training session. Their performance was tested again two months later (in yellow). n = 18.
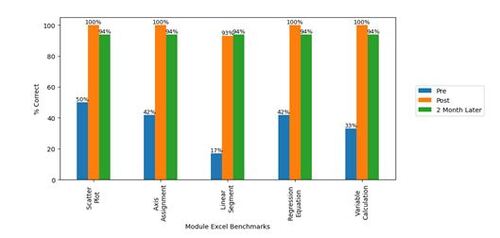
Figure 3. Assessment results of Module R in Phase 2, n = 38. The benchmarks are described in .
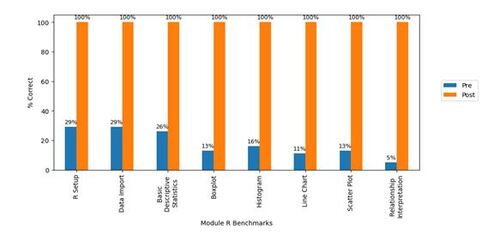
Figure 4. Responses from participants in Phase 2 on perceived difficulty, training pace, and skill applicability. n = 22.
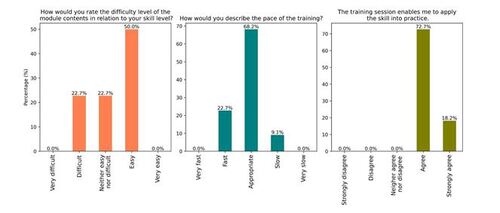
Figure 5. Performance of students in the exit quiz in Phase 3. n = 22.
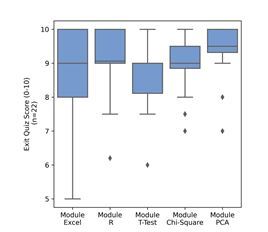
Figure 6. Participants’ responses for modules in Phase 3: (a) perceived difficulty level, (b) perceived pace, (c) training applicability, and (d) instruction clarify in TA-led session.
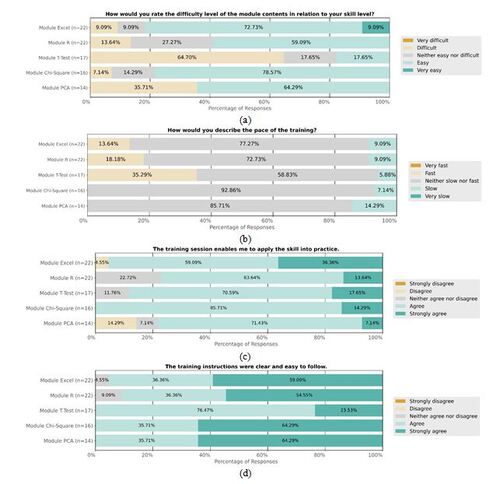
Figure 7. Ratings of participants in Phase 3.

Figure 8. Word cloud of the required or desired skills in the job postings related to natural science careers.