Figures & data
Figure 1. (a) Schematic physical structure of the NV center. (b) Energy levels and hyperfine structure of NV center interacting with nearby nuclear spins. Hyperfine sublevels linked to the intrinsic
nuclear spins of the NV center and P1 centers are not shown. The right panel shows a typical ODMR signal of
and
electron spin sublevels with a 52 mT magnetic field along one of four axes of NV center ensemble.
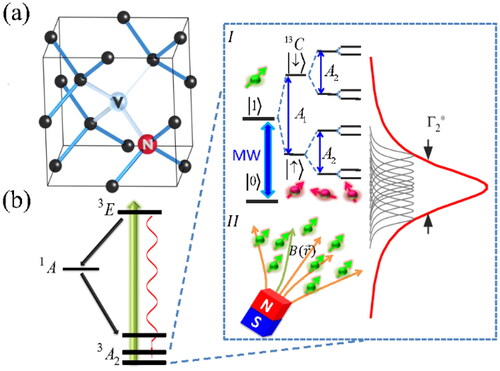
Figure 2. (a) ODMR spectrum of NV center ensemble under B ≈ 500 G magnetic field. (b) The longitudinal depolarization process of NV center ensemble. (c) Ramsey fringe for total inhomogeneous broadening. (d) Spin-echo sequence for pure dephasing process. The decay law [Citation5] for coherence of NV centers can be characterized by with ν ⊂ [Citation3, Citation6] and we chose ν = 3 for our diamond sample.
![Figure 2. (a) ODMR spectrum of NV center ensemble under B ≈ 500 G magnetic field. (b) The longitudinal depolarization process of NV center ensemble. (c) Ramsey fringe for total inhomogeneous broadening. (d) Spin-echo sequence for pure dephasing process. The decay law [Citation5] for coherence of NV centers can be characterized by exp (−χ) = exp (−ατv) with ν ⊂ [Citation3, Citation6] and we chose ν = 3 for our diamond sample.](/cms/asset/8da47128-ddf0-4685-ba84-f3b5023f12af/tfdi_a_1898792_f0002_c.jpg)
Figure 3. (a) General rectangular and composite sequence for π-pulse. (b, c) Simulated quantum control fidelity of rectangular (b) and composite (c) dynamical pulses for a range of detuning and control amplitude, scaled by Rabi frequency. Navy lines are contour lines at a fidelity of 0.9. (d) Measured (dots) and simulated (solid lines) fidelity of π pulse. Red (gray) dots correspond to composite (rectangular) pulses.
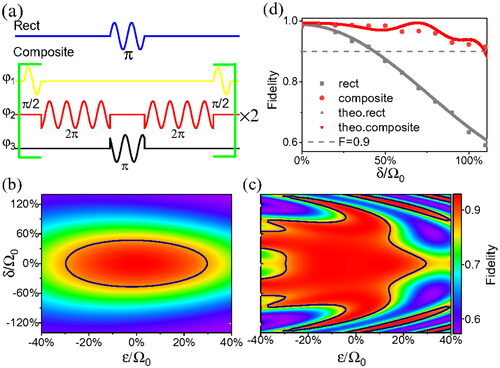
Figure 4. (a) AC magnetic-field measurement scheme with pulsed sensing readout. The NV center ensemble is initialized by 12 mW 532 nm laser pulse with 4 µs duration. (b) Results of the spin-echo sensing sequence as a function of sensing time and the amplitude of AC magnetic field. (c) Results with fixed amplitude of AC magnetic field. (d) Results as a function of the amplitude of AC magnetic field with fixed sensing time (τ). (e) Measured NV center ensemble-based sensitivity times root sensing volume using rectangular (gray) and composite pulse (red). Grey and green solid lines are theoretical simulation results. (f) Relative sensitivity enhancement of composite-pulse compared to rectangular pulse sequences.
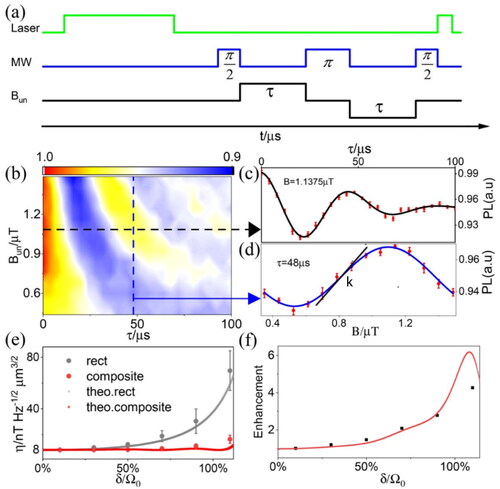
Figure 5. (a, b) The dynamical process of spin-echo sensing protocol with 110% detuning with rectangular (a) and composite (b) dynamical pulses. Red and grey dots (curves) are experimental data (theoretical simulation results). Navy dashed line is ideal result without detuning and decoherence.
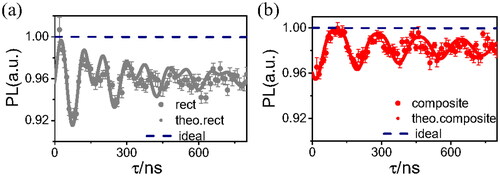
Figure 6. (a) Improved magnetometric sensitivity under multipulse sequence for dynamical composite-pulse. The white lines are contour lines at sensitivity
. (b) The relative sensitivity enhancement of composite-pulse sequence compared to rectangular pulse for multipulse sequences.
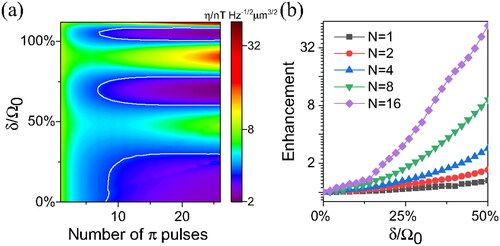
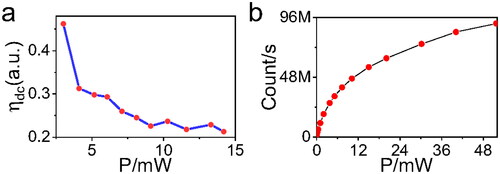
Figure A1. (a) Corresponding magnetic field sensitivities with the power of 532 nm laser. (b) The fluorescence saturation curve versus excitation power.