
Figures & data
Table 1. The detection limit and linear range of aniline detection by various methods.
Figure 1. SEM images of BND (a) and BDD (b) films.
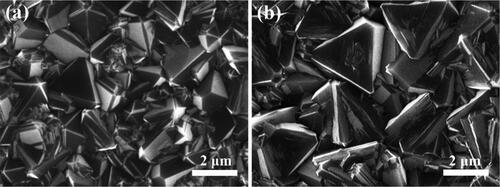
Figure 2. (a) Raman spectra and (b) XRD patterns of BND and BDD films.
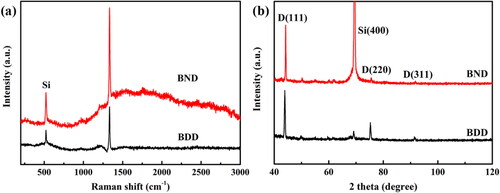
Figure 3. XPS spectra of the BND and BDD electrodes. (a) B 1 s, (c) N 1 s, and (e) C 1 s of the BND electrode: (b) B 1 s, (d) N 1 s, and (f) C 1 s of the BDD electrode.
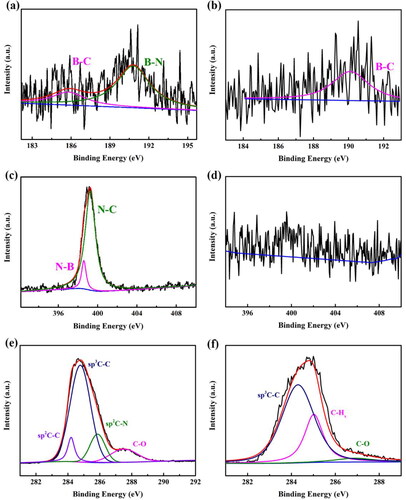
Figure 4. CVs on the BND electrode (red line) and BDD electrode (black line) in pH 2.0 buffer solution containing 100 μmol L−1 aniline. The scan rate is 0.3 V s−1.
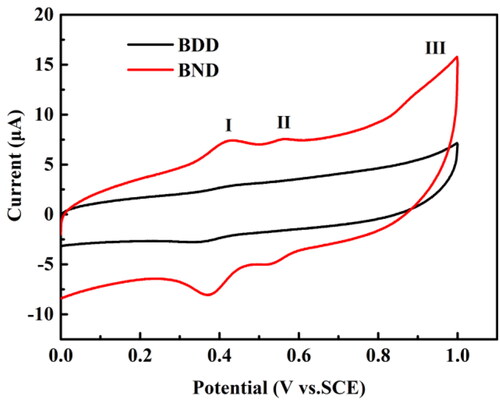
Figure 5. (a) Five CVs of 100 μmol L−1 aniline on the BND electrode at different scan rates in 0.1 mol L−1 PBS (pH = 2.0). The scan rates are 0.1, 0.2, 0.3, 0.4 and 0.5 V s−1. (b) DNPV curves of 100 μmol L−1 aniline on the BND electrode in 0.1 mol L−1 PBS with pH value of 2.0, 4.0, 5.8, 7.0 and 8.0.
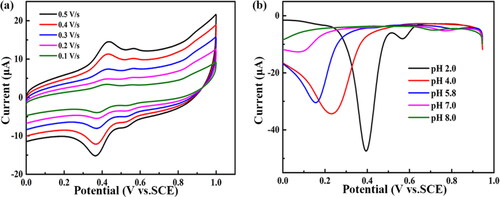
Figure 6. The DNPV diagrams of aniline with the different concentration from 0.5 μmol L−1 to 500 μmol L−1 on the BND electrode in 0.1 mol L−1 PBS (pH = 2.0) buffer solution.
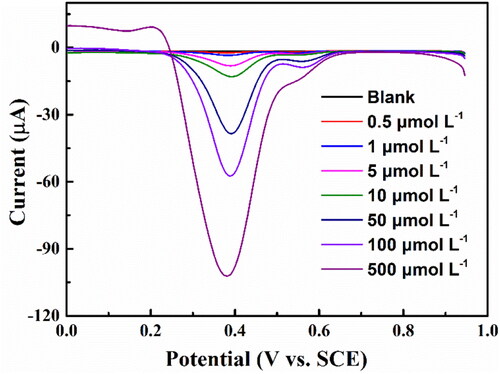
Figure 7. Calibration curve of aniline detections for BND electrode. The error bars represent the relative standard deviations of triple measurements.
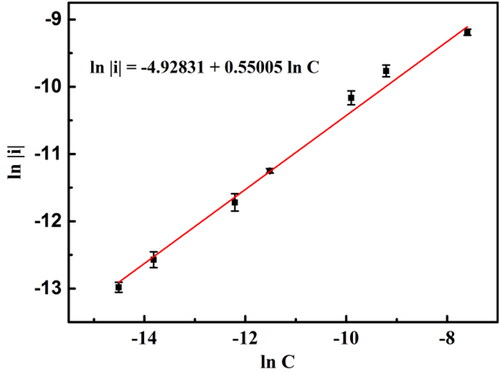
Table 2. Recoveries of aniline with varying concentrations added in natural water samples.